
|
Bank of India Limited (Bankindia.NS) Valoración de DCF |
Completamente Editable: Adáptelo A Sus Necesidades En Excel O Sheets
Diseño Profesional: Plantillas Confiables Y Estándares De La Industria
Predeterminadas Para Un Uso Rápido Y Eficiente
Compatible con MAC / PC, completamente desbloqueado
No Se Necesita Experiencia; Fáciles De Seguir
Bank of India Limited (BANKINDIA.NS) Bundle
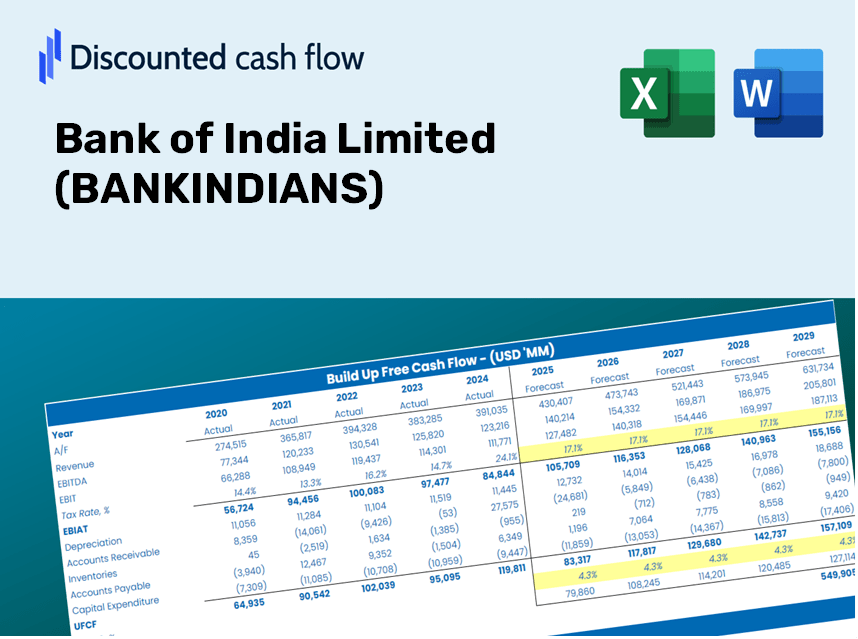
Como inversor o analista, esta calculadora DCF (bankindian) es la herramienta perfecta para una valoración precisa. Con datos reales de Bank of India Limited, puede ajustar los pronósticos e inmediatamente observar los efectos.
Discounted Cash Flow (DCF) - (USD MM)
| Year | AY1 2021 |
AY2 2022 |
AY3 2023 |
AY4 2024 |
AY5 2025 |
FY1 2026 |
FY2 2027 |
FY3 2028 |
FY4 2029 |
FY5 2030 |
|---|---|---|---|---|---|---|---|---|---|---|
| Revenue | 142,841.7 | 177,437.5 | 204,722.5 | 672,058.9 | 297,682.4 | 360,114.6 | 435,640.5 | 527,006.4 | 637,534.1 | 771,242.6 |
| Revenue Growth, % | 0 | 24.22 | 15.38 | 228.28 | -55.71 | 20.97 | 20.97 | 20.97 | 20.97 | 20.97 |
| EBITDA | 32,176.1 | 59,371.6 | 65,252.2 | 107,018.3 | 131,618.9 | 106,592.7 | 128,948.1 | 155,992.0 | 188,707.9 | 228,285.1 |
| EBITDA, % | 22.53 | 33.46 | 31.87 | 15.92 | 44.21 | 29.6 | 29.6 | 29.6 | 29.6 | 29.6 |
| Depreciation | .0 | 3,635.1 | 4,265.1 | 5,087.0 | 6,035.6 | 4,981.4 | 6,026.2 | 7,290.0 | 8,819.0 | 10,668.6 |
| Depreciation, % | 0 | 2.05 | 2.08 | 0.75693 | 2.03 | 1.38 | 1.38 | 1.38 | 1.38 | 1.38 |
| EBIT | 32,176.1 | 55,736.5 | 60,987.1 | 101,931.3 | 125,583.3 | 101,611.2 | 122,921.9 | 148,702.0 | 179,888.9 | 217,616.5 |
| EBIT, % | 22.53 | 31.41 | 29.79 | 15.17 | 42.19 | 28.22 | 28.22 | 28.22 | 28.22 | 28.22 |
| Total Cash | 1,266,936.3 | 536,254.6 | 846,832.8 | 831,229.7 | 1,008,371.7 | 360,114.6 | 435,640.5 | 527,006.4 | 637,534.1 | 771,242.6 |
| Total Cash, percent | .0 | .0 | .0 | .0 | .0 | .0 | .0 | .0 | .0 | .0 |
| Account Receivables | 122,274.1 | 202,140.1 | 399,816.7 | 486,334.5 | 502,935.9 | 329,840.5 | 399,017.1 | 482,702.0 | 583,937.9 | 706,405.7 |
| Account Receivables, % | 85.6 | 113.92 | 195.3 | 72.36 | 168.95 | 91.59 | 91.59 | 91.59 | 91.59 | 91.59 |
| Inventories | .0 | -1,148,927.6 | -1,283,102.2 | -1,317,564.2 | .0 | -216,068.8 | -261,384.3 | -316,203.8 | -382,520.5 | -462,745.5 |
| Inventories, % | 0 | -647.51 | -626.75 | -196.05 | 0 | -60 | -60 | -60 | -60 | -60 |
| Accounts Payable | 16,476.9 | 17,395.3 | 25,795.8 | 32,009.0 | 36,633.7 | 36,737.6 | 44,442.5 | 53,763.3 | 65,039.0 | 78,679.4 |
| Accounts Payable, % | 11.54 | 9.8 | 12.6 | 4.76 | 12.31 | 10.2 | 10.2 | 10.2 | 10.2 | 10.2 |
| Capital Expenditure | -3,490.0 | -5,719.8 | -6,232.9 | -8,505.3 | -7,230.5 | -8,935.0 | -10,809.0 | -13,075.9 | -15,818.3 | -19,135.8 |
| Capital Expenditure, % | -2.44 | -3.22 | -3.04 | -1.27 | -2.43 | -2.48 | -2.48 | -2.48 | -2.48 | -2.48 |
| Tax Rate, % | 25.23 | 25.23 | 25.23 | 25.23 | 25.23 | 25.23 | 25.23 | 25.23 | 25.23 | 25.23 |
| EBITAT | 21,209.9 | 34,424.3 | 38,650.5 | 64,492.8 | 93,892.6 | 66,878.8 | 80,905.2 | 97,873.2 | 118,399.9 | 143,231.6 |
| Depreciation | ||||||||||
| Changes in Account Receivables | ||||||||||
| Changes in Inventories | ||||||||||
| Changes in Accounts Payable | ||||||||||
| Capital Expenditure | ||||||||||
| UFCF | -88,077.2 | 1,102,319.6 | -18,418.7 | 15,231.9 | -1,236,843.2 | 452,193.3 | 59,966.2 | 72,542.8 | 87,757.0 | 106,162.1 |
| WACC, % | 19.44 | 18.36 | 18.78 | 18.75 | 21.73 | 19.41 | 19.41 | 19.41 | 19.41 | 19.41 |
| PV UFCF | ||||||||||
| SUM PV UFCF | 550,231.3 | |||||||||
| Long Term Growth Rate, % | 2.00 | |||||||||
| Free cash flow (T + 1) | 108,285 | |||||||||
| Terminal Value | 621,917 | |||||||||
| Present Terminal Value | 256,154 | |||||||||
| Enterprise Value | 806,385 | |||||||||
| Net Debt | 230,323 | |||||||||
| Equity Value | 576,062 | |||||||||
| Diluted Shares Outstanding, MM | 4,553 | |||||||||
| Equity Value Per Share | 126.52 |
What You Will Receive
- Pre-Filled Financial Model: Utilize actual data from Bank of India Limited (BANKINDIANS) for accurate DCF valuation.
- Comprehensive Forecast Control: Modify revenue growth, profit margins, WACC, and other essential variables.
- Real-Time Calculations: Instantaneous updates allow you to view results as you make adjustments.
- Investor-Ready Template: A polished Excel sheet crafted for top-tier valuation standards.
- Customizable and Reusable: Designed for versatility, enabling repeated applications for in-depth forecasts.
Key Features
- Comprehensive DCF Calculator: Features detailed unlevered and levered DCF valuation models tailored for Bank of India Limited (BANKINDIANS).
- WACC Calculator: Ready-to-use Weighted Average Cost of Capital sheet with adjustable inputs for precise calculations.
- Customizable Forecast Assumptions: Easily modify growth rates, capital expenditures, and discount rates to suit your analysis.
- Integrated Financial Ratios: Evaluate profitability, leverage, and efficiency ratios specifically for Bank of India Limited (BANKINDIANS).
- Interactive Dashboard and Charts: Visual representations that highlight key valuation metrics for clear and concise analysis.
How It Works
- Step 1: Download the prebuilt Excel template featuring Bank of India Limited's (BANKINDIANS) data.
- Step 2: Navigate through the pre-filled sheets to familiarize yourself with the essential metrics.
- Step 3: Adjust forecasts and assumptions in the editable yellow cells (WACC, growth, margins).
- Step 4: Immediately view the recalculated results, including Bank of India Limited's (BANKINDIANS) intrinsic value.
- Step 5: Make well-informed investment decisions or create reports based on the generated outputs.
Why Opt for This Calculator?
- All-in-One Solution: Combines DCF, WACC, and financial ratios in a single, convenient tool.
- Flexible Settings: Modify the yellow-highlighted cells to experiment with different scenarios.
- In-Depth Analysis: Automatically determines the intrinsic value and Net Present Value for Bank of India Limited (BANKINDIANS).
- Data Ready: Includes both historical and projected data for reliable calculations.
- Expert Level: Perfect for financial analysts, investors, and business advisors.
Who Should Consider Using BANKINDIANS?
- Investors: Evaluate Bank of India Limited's (BANKINDIANS) valuation prior to making stock trades.
- CFOs and Financial Analysts: Optimize valuation workflows and examine financial forecasts.
- Startup Founders: Gain insights into how major banking institutions like Bank of India are appraised.
- Consultants: Provide expert valuation reports to clients regarding BANKINDIANS.
- Students and Educators: Utilize authentic data to practice and instruct on valuation methodologies.
What the Template Contains
- Historical Data: Incorporates Bank of India Limited's (BANKINDIANS) previous financials and foundational forecasts.
- DCF and Levered DCF Models: Comprehensive templates for determining the intrinsic value of Bank of India Limited (BANKINDIANS).
- WACC Sheet: Pre-configured calculations for the Weighted Average Cost of Capital.
- Editable Inputs: Customize key drivers such as growth rates, EBITDA percentages, and CAPEX projections.
- Quarterly and Annual Statements: A thorough analysis of Bank of India Limited's (BANKINDIANS) financials.
- Interactive Dashboard: Visualize valuation outcomes and forecasts interactively.
Disclaimer
All information, articles, and product details provided on this website are for general informational and educational purposes only. We do not claim any ownership over, nor do we intend to infringe upon, any trademarks, copyrights, logos, brand names, or other intellectual property mentioned or depicted on this site. Such intellectual property remains the property of its respective owners, and any references here are made solely for identification or informational purposes, without implying any affiliation, endorsement, or partnership.
We make no representations or warranties, express or implied, regarding the accuracy, completeness, or suitability of any content or products presented. Nothing on this website should be construed as legal, tax, investment, financial, medical, or other professional advice. In addition, no part of this site—including articles or product references—constitutes a solicitation, recommendation, endorsement, advertisement, or offer to buy or sell any securities, franchises, or other financial instruments, particularly in jurisdictions where such activity would be unlawful.
All content is of a general nature and may not address the specific circumstances of any individual or entity. It is not a substitute for professional advice or services. Any actions you take based on the information provided here are strictly at your own risk. You accept full responsibility for any decisions or outcomes arising from your use of this website and agree to release us from any liability in connection with your use of, or reliance upon, the content or products found herein.