
|
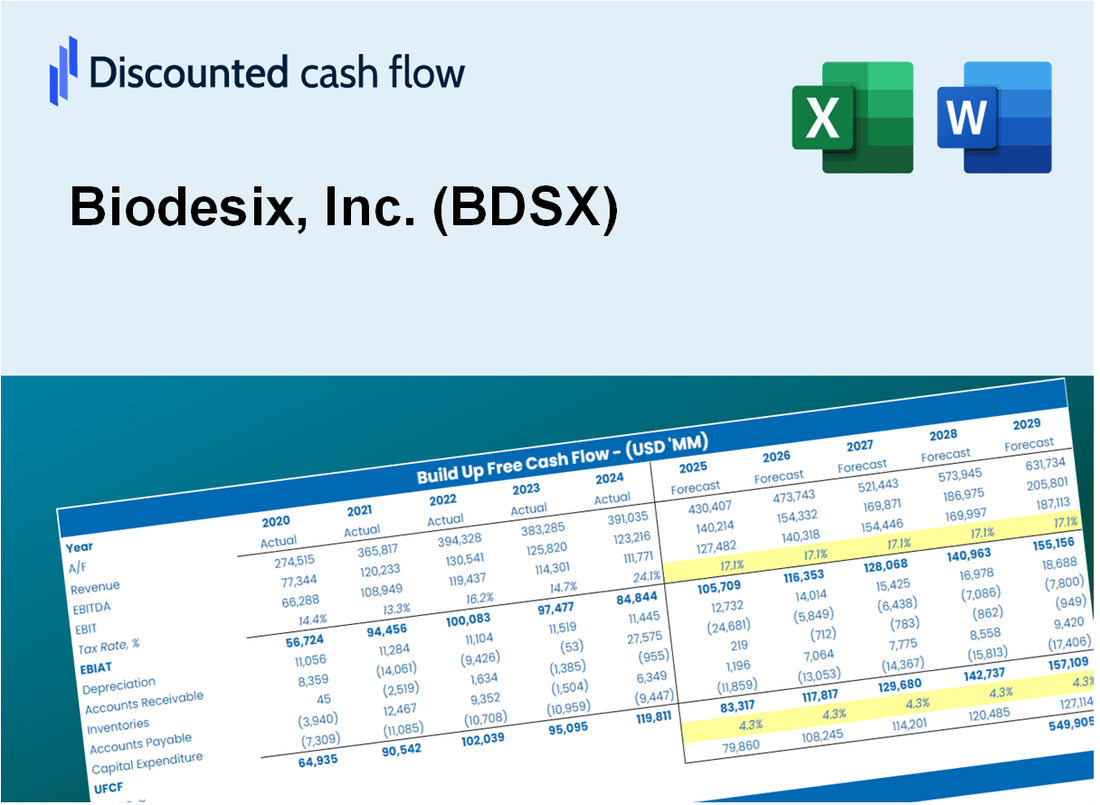
Valoración DCF de Biodesix, Inc. (BDSX) |
Completamente Editable: Adáptelo A Sus Necesidades En Excel O Sheets
Diseño Profesional: Plantillas Confiables Y Estándares De La Industria
Predeterminadas Para Un Uso Rápido Y Eficiente
Compatible con MAC / PC, completamente desbloqueado
No Se Necesita Experiencia; Fáciles De Seguir
Biodesix, Inc. (BDSX) Bundle
¡Evalúe las perspectivas financieras de Biodesix, Inc. (BDSX) como un experto! Esta calculadora DCF (BDSX) proporciona datos financieros preconsados junto con la flexibilidad para modificar el crecimiento de los ingresos, WACC, los márgenes y otros supuestos cruciales para alinearse con sus proyecciones.
Discounted Cash Flow (DCF) - (USD MM)
| Year | AY1 2020 |
AY2 2021 |
AY3 2022 |
AY4 2023 |
AY5 2024 |
FY1 2025 |
FY2 2026 |
FY3 2027 |
FY4 2028 |
FY5 2029 |
|---|---|---|---|---|---|---|---|---|---|---|
| Revenue | 45.6 | 54.5 | 38.2 | 49.1 | 71.3 | 82.6 | 95.8 | 111.0 | 128.6 | 149.0 |
| Revenue Growth, % | 0 | 19.64 | -29.89 | 28.46 | 45.3 | 15.88 | 15.88 | 15.88 | 15.88 | 15.88 |
| EBITDA | -20.8 | -35.5 | -51.5 | -37.1 | -29.2 | -54.1 | -62.7 | -72.7 | -84.2 | -97.6 |
| EBITDA, % | -45.75 | -65.08 | -134.86 | -75.59 | -40.96 | -65.48 | -65.48 | -65.48 | -65.48 | -65.48 |
| Depreciation | 2.9 | 3.2 | 5.8 | 5.5 | 5.5 | 7.7 | 8.9 | 10.3 | 11.9 | 13.8 |
| Depreciation, % | 6.37 | 5.83 | 15.29 | 11.22 | 7.65 | 9.27 | 9.27 | 9.27 | 9.27 | 9.27 |
| EBIT | -23.7 | -38.7 | -57.4 | -42.6 | -34.7 | -59.3 | -68.7 | -79.6 | -92.2 | -106.8 |
| EBIT, % | -52.12 | -70.91 | -150.15 | -86.81 | -48.61 | -71.69 | -71.69 | -71.69 | -71.69 | -71.69 |
| Total Cash | 62.1 | 32.7 | 43.1 | 26.3 | 26.2 | 57.9 | 67.1 | 77.8 | 90.1 | 104.4 |
| Total Cash, percent | .0 | .0 | .0 | .0 | .0 | .0 | .0 | .0 | .0 | .0 |
| Account Receivables | 15.3 | 3.7 | 5.1 | 7.7 | 8.6 | 13.4 | 15.6 | 18.0 | 20.9 | 24.2 |
| Account Receivables, % | 33.59 | 6.71 | 13.25 | 15.64 | 12.06 | 16.25 | 16.25 | 16.25 | 16.25 | 16.25 |
| Inventories | 3.2 | 2.9 | 1.4 | 1.4 | .0 | 3.1 | 3.6 | 4.2 | 4.9 | 5.6 |
| Inventories, % | 7.02 | 5.32 | 3.66 | 2.85 | 0 | 3.77 | 3.77 | 3.77 | 3.77 | 3.77 |
| Accounts Payable | 9.0 | 1.7 | 1.7 | 2.9 | 2.2 | 6.0 | 6.9 | 8.0 | 9.3 | 10.8 |
| Accounts Payable, % | 19.68 | 3.05 | 4.41 | 5.97 | 3.08 | 7.24 | 7.24 | 7.24 | 7.24 | 7.24 |
| Capital Expenditure | -2.2 | -2.5 | -3.5 | -23.1 | -3.2 | -11.6 | -13.4 | -15.6 | -18.1 | -20.9 |
| Capital Expenditure, % | -4.78 | -4.67 | -9.25 | -46.98 | -4.53 | -14.04 | -14.04 | -14.04 | -14.04 | -14.04 |
| Tax Rate, % | 0 | 0 | 0 | 0 | 0 | 0 | 0 | 0 | 0 | 0 |
| EBITAT | -23.7 | -38.7 | -57.4 | -42.6 | -34.7 | -59.3 | -68.7 | -79.6 | -92.2 | -106.8 |
| Depreciation | ||||||||||
| Changes in Account Receivables | ||||||||||
| Changes in Inventories | ||||||||||
| Changes in Accounts Payable | ||||||||||
| Capital Expenditure | ||||||||||
| UFCF | -32.6 | -33.4 | -55.0 | -61.5 | -32.7 | -67.4 | -74.9 | -86.8 | -100.6 | -116.5 |
| WACC, % | 10.34 | 10.34 | 10.34 | 10.34 | 10.34 | 10.34 | 10.34 | 10.34 | 10.34 | 10.34 |
| PV UFCF | ||||||||||
| SUM PV UFCF | -326.3 | |||||||||
| Long Term Growth Rate, % | 2.00 | |||||||||
| Free cash flow (T + 1) | -119 | |||||||||
| Terminal Value | -1,426 | |||||||||
| Present Terminal Value | -872 | |||||||||
| Enterprise Value | -1,198 | |||||||||
| Net Debt | 36 | |||||||||
| Equity Value | -1,234 | |||||||||
| Diluted Shares Outstanding, MM | 6 | |||||||||
| Equity Value Per Share | -190.29 |
What You Will Receive
- Pre-Filled Financial Model: Biodesix’s actual data allows for accurate DCF valuation.
- Comprehensive Forecast Control: Modify revenue growth, profit margins, WACC, and other essential drivers.
- Real-Time Calculations: Automatic updates provide immediate results as you adjust inputs.
- Investor-Ready Template: A polished Excel file crafted for high-quality valuation.
- Customizable and Reusable: Designed for adaptability, enabling repeated use for in-depth forecasts.
Key Features
- Comprehensive BDSX Data: Pre-filled with Biodesix's historical performance metrics and future projections.
- Fully Customizable Inputs: Modify revenue growth rates, profit margins, discount rates, tax implications, and capital investments.
- Dynamic Valuation Model: Real-time updates to Net Present Value (NPV) and intrinsic value based on your adjustments.
- Scenario Testing: Develop various forecasting scenarios to evaluate different valuation possibilities.
- User-Friendly Interface: Intuitive, organized, and tailored for both experienced professionals and newcomers.
How It Works
- Step 1: Download the prebuilt Excel template containing Biodesix, Inc. (BDSX) data.
- Step 2: Review the pre-filled sheets to familiarize yourself with the essential metrics.
- Step 3: Modify forecasts and assumptions in the editable yellow cells (WACC, growth, margins).
- Step 4: Instantly see the recalculated results, including the intrinsic value of Biodesix, Inc. (BDSX).
- Step 5: Use the outputs to make informed investment decisions or create detailed reports.
Why Choose Biodesix, Inc. (BDSX) Calculator?
- Accuracy: Utilizes real Biodesix financial data for precise calculations.
- Flexibility: Allows users to easily adjust and test various input parameters.
- Time-Saving: Eliminate the need to create a financial model from the ground up.
- Professional-Grade: Crafted with the expertise and precision expected at the CFO level.
- User-Friendly: Intuitive design makes it accessible for users without extensive financial modeling skills.
Who Should Use This Product?
- Healthcare Investors: Develop comprehensive and accurate valuation models for Biodesix, Inc. (BDSX) analysis.
- Biotech Finance Teams: Evaluate valuation scenarios to inform strategic decisions within the organization.
- Consultants and Advisors: Deliver precise valuation insights for clients interested in Biodesix, Inc. (BDSX).
- Students and Educators: Utilize real-world data to practice and teach financial modeling in the biotech sector.
- Life Sciences Enthusiasts: Gain insights into how biotech companies like Biodesix, Inc. (BDSX) are valued in the market.
What the Template Contains
- Historical Data: Includes Biodesix, Inc.'s (BDSX) past financials and baseline forecasts.
- DCF and Levered DCF Models: Detailed templates to calculate Biodesix, Inc.'s (BDSX) intrinsic value.
- WACC Sheet: Pre-built calculations for Weighted Average Cost of Capital.
- Editable Inputs: Modify key drivers like growth rates, EBITDA %, and CAPEX assumptions.
- Quarterly and Annual Statements: A complete breakdown of Biodesix, Inc.'s (BDSX) financials.
- Interactive Dashboard: Visualize valuation results and projections dynamically.
Disclaimer
All information, articles, and product details provided on this website are for general informational and educational purposes only. We do not claim any ownership over, nor do we intend to infringe upon, any trademarks, copyrights, logos, brand names, or other intellectual property mentioned or depicted on this site. Such intellectual property remains the property of its respective owners, and any references here are made solely for identification or informational purposes, without implying any affiliation, endorsement, or partnership.
We make no representations or warranties, express or implied, regarding the accuracy, completeness, or suitability of any content or products presented. Nothing on this website should be construed as legal, tax, investment, financial, medical, or other professional advice. In addition, no part of this site—including articles or product references—constitutes a solicitation, recommendation, endorsement, advertisement, or offer to buy or sell any securities, franchises, or other financial instruments, particularly in jurisdictions where such activity would be unlawful.
All content is of a general nature and may not address the specific circumstances of any individual or entity. It is not a substitute for professional advice or services. Any actions you take based on the information provided here are strictly at your own risk. You accept full responsibility for any decisions or outcomes arising from your use of this website and agree to release us from any liability in connection with your use of, or reliance upon, the content or products found herein.