
|
Valoración DCF de BIO-key International, Inc. (BKYI) |
Completamente Editable: Adáptelo A Sus Necesidades En Excel O Sheets
Diseño Profesional: Plantillas Confiables Y Estándares De La Industria
Predeterminadas Para Un Uso Rápido Y Eficiente
Compatible con MAC / PC, completamente desbloqueado
No Se Necesita Experiencia; Fáciles De Seguir
BIO-key International, Inc. (BKYI) Bundle
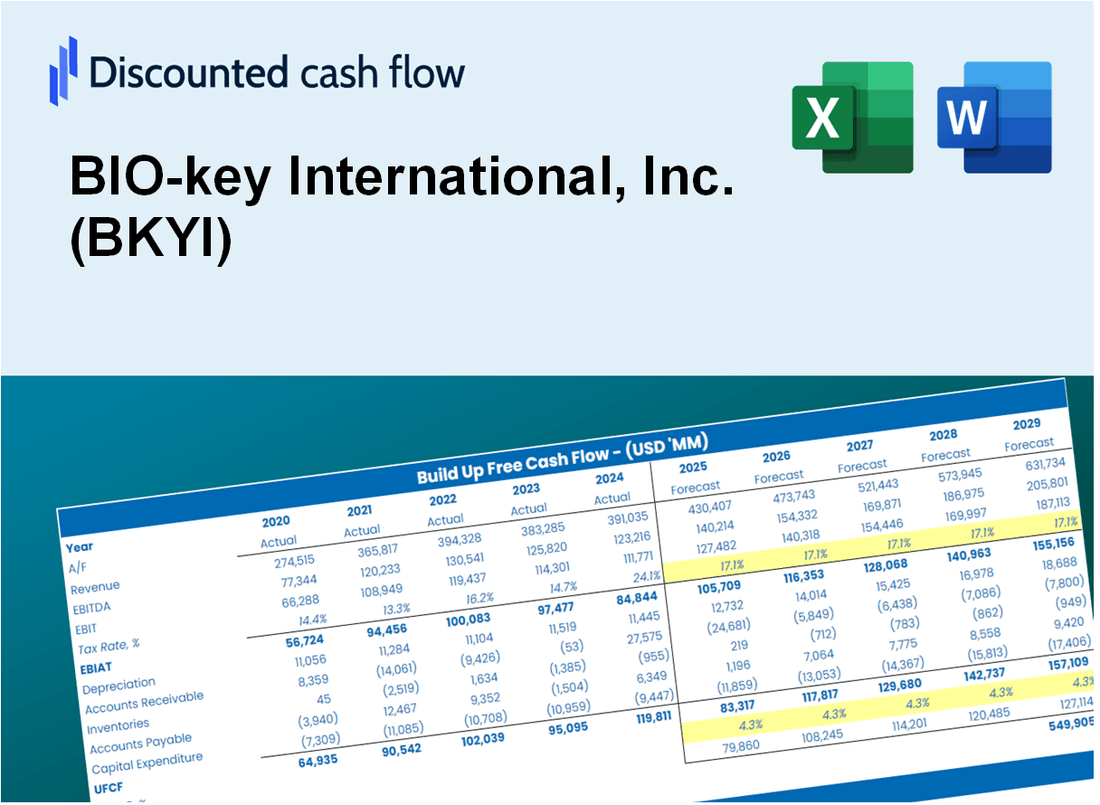
Ya sea que sea un inversionista o analista, esta calculadora DCF (BKYI) es su recurso de referencia para una valoración precisa. Cargados con datos reales de Bio-Key International, Inc., puede ajustar fácilmente los pronósticos y observar los cambios en tiempo real.
Discounted Cash Flow (DCF) - (USD MM)
| Year | AY1 2020 |
AY2 2021 |
AY3 2022 |
AY4 2023 |
AY5 2024 |
FY1 2025 |
FY2 2026 |
FY3 2027 |
FY4 2028 |
FY5 2029 |
|---|---|---|---|---|---|---|---|---|---|---|
| Revenue | 2.8 | 5.1 | 7.0 | 7.8 | 6.9 | 9.0 | 11.6 | 15.0 | 19.4 | 25.1 |
| Revenue Growth, % | 0 | 80.29 | 37.26 | 10.46 | -10.64 | 29.34 | 29.34 | 29.34 | 29.34 | 29.34 |
| EBITDA | -4.9 | -4.5 | -11.4 | -7.8 | -3.5 | -7.9 | -10.2 | -13.2 | -17.1 | -22.1 |
| EBITDA, % | -172.87 | -88.64 | -162.01 | -101.19 | -51.18 | -87.96 | -87.96 | -87.96 | -87.96 | -87.96 |
| Depreciation | .4 | .5 | .5 | .6 | .5 | .8 | 1.1 | 1.4 | 1.8 | 2.4 |
| Depreciation, % | 15.05 | 10.05 | 7.78 | 7.61 | 6.89 | 9.48 | 9.48 | 9.48 | 9.48 | 9.48 |
| EBIT | -5.3 | -5.0 | -11.9 | -8.4 | -4.0 | -8.2 | -10.6 | -13.7 | -17.7 | -22.9 |
| EBIT, % | -187.92 | -98.7 | -169.79 | -108.8 | -58.07 | -91.35 | -91.35 | -91.35 | -91.35 | -91.35 |
| Total Cash | 17.5 | 7.8 | 2.6 | .5 | .4 | 4.5 | 5.8 | 7.5 | 9.7 | 12.6 |
| Total Cash, percent | .0 | .0 | .0 | .0 | .0 | .0 | .0 | .0 | .0 | .0 |
| Account Receivables | .9 | 1.1 | 1.6 | 1.3 | .8 | 1.9 | 2.4 | 3.1 | 4.0 | 5.2 |
| Account Receivables, % | 31.85 | 21.55 | 22.4 | 16.77 | 11.44 | 20.8 | 20.8 | 20.8 | 20.8 | 20.8 |
| Inventories | .3 | 4.9 | 4.8 | .4 | .4 | 3.4 | 4.4 | 5.6 | 7.3 | 9.4 |
| Inventories, % | 11.67 | 96.6 | 68.86 | 5.75 | 5.46 | 37.67 | 37.67 | 37.67 | 37.67 | 37.67 |
| Accounts Payable | .2 | .4 | 1.1 | 1.3 | .8 | 1.1 | 1.4 | 1.8 | 2.4 | 3.1 |
| Accounts Payable, % | 8.61 | 8.36 | 15.79 | 16.97 | 11.81 | 12.31 | 12.31 | 12.31 | 12.31 | 12.31 |
| Capital Expenditure | .0 | .0 | -.1 | .0 | .0 | -.1 | -.1 | -.1 | -.1 | -.2 |
| Capital Expenditure, % | -1.25 | -0.82167 | -1.17 | -0.01289506 | -0.18828 | -0.68905 | -0.68905 | -0.68905 | -0.68905 | -0.68905 |
| Tax Rate, % | 0.53191 | 0.53191 | 0.53191 | 0.53191 | 0.53191 | 0.53191 | 0.53191 | 0.53191 | 0.53191 | 0.53191 |
| EBITAT | -5.3 | -5.0 | -11.9 | -8.3 | -4.0 | -8.2 | -10.5 | -13.6 | -17.6 | -22.8 |
| Depreciation | ||||||||||
| Changes in Account Receivables | ||||||||||
| Changes in Inventories | ||||||||||
| Changes in Accounts Payable | ||||||||||
| Capital Expenditure | ||||||||||
| UFCF | -5.9 | -9.2 | -11.1 | -2.9 | -3.5 | -11.1 | -10.7 | -13.9 | -18.0 | -23.2 |
| WACC, % | 9.19 | 9.19 | 9.18 | 9.1 | 9.16 | 9.16 | 9.16 | 9.16 | 9.16 | 9.16 |
| PV UFCF | ||||||||||
| SUM PV UFCF | -57.5 | |||||||||
| Long Term Growth Rate, % | 2.00 | |||||||||
| Free cash flow (T + 1) | -24 | |||||||||
| Terminal Value | -331 | |||||||||
| Present Terminal Value | -213 | |||||||||
| Enterprise Value | -271 | |||||||||
| Net Debt | 1 | |||||||||
| Equity Value | -272 | |||||||||
| Diluted Shares Outstanding, MM | 4 | |||||||||
| Equity Value Per Share | -70.41 |
What You Will Receive
- Authentic BIO-key Data: Preloaded financials – encompassing revenue to EBIT – derived from actual and projected metrics.
- Comprehensive Customization: Modify all essential parameters (yellow cells) such as WACC, growth %, and tax rates.
- Immediate Valuation Adjustments: Automatic recalculations to evaluate the effects of changes on BIO-key's fair value.
- Flexible Excel Template: Designed for quick modifications, scenario analysis, and in-depth projections.
- Efficient and Precise: Bypass the hassle of building models from the ground up while ensuring accuracy and adaptability.
Key Features
- Customizable Growth Metrics: Adjust essential parameters such as revenue projections, profit margins, and investment costs.
- Instant DCF Calculations: Quickly determines intrinsic value, net present value (NPV), and other financial metrics.
- High-Precision Valuation: Incorporates BIO-key International's (BKYI) actual financial data for accurate valuation results.
- Effortless Scenario Testing: Easily evaluate various assumptions and analyze their impacts on outcomes.
- Efficiency Booster: Save time by avoiding the complexities of creating detailed valuation models from the ground up.
How It Works
- Step 1: Download the Excel file.
- Step 2: Review pre-entered BIO-key International, Inc. (BKYI) data (historical and projected).
- Step 3: Adjust key assumptions (yellow cells) based on your analysis.
- Step 4: View automatic recalculations for BIO-key International, Inc. (BKYI)’s intrinsic value.
- Step 5: Use the outputs for investment decisions or reporting.
Why Choose This Calculator for BIO-key International, Inc. (BKYI)?
- User-Friendly Interface: Tailored for both novices and seasoned professionals.
- Customizable Inputs: Adjust parameters effortlessly to suit your financial analysis.
- Real-Time Adjustments: Observe immediate changes to BIO-key’s valuation as you tweak inputs.
- Preloaded Data: Comes equipped with BIO-key’s latest financial information for swift evaluations.
- Industry Approved: Favored by investors and analysts for making well-informed choices.
Who Should Use This Product?
- Investors: Evaluate BIO-key International, Inc.'s (BKYI) market potential before making investment decisions.
- CFOs and Financial Analysts: Optimize valuation methodologies and assess financial forecasts for BIO-key.
- Startup Founders: Understand the valuation strategies applied to innovative tech companies like BIO-key.
- Consultants: Provide detailed valuation analyses and reports for clients considering BIO-key.
- Students and Educators: Utilize real-time data to learn and teach valuation principles related to BIO-key International, Inc. (BKYI).
What the Template Contains
- Pre-Filled Data: Contains BIO-key International, Inc.'s historical financials and projections.
- Discounted Cash Flow Model: Editable DCF valuation model featuring automatic calculations.
- Weighted Average Cost of Capital (WACC): A dedicated sheet for calculating WACC based on user-defined inputs.
- Key Financial Ratios: Evaluate BIO-key International, Inc.'s profitability, efficiency, and leverage.
- Customizable Inputs: Easily modify revenue growth, margins, and tax rates.
- Clear Dashboard: Visuals and tables summarizing essential valuation results.
Disclaimer
All information, articles, and product details provided on this website are for general informational and educational purposes only. We do not claim any ownership over, nor do we intend to infringe upon, any trademarks, copyrights, logos, brand names, or other intellectual property mentioned or depicted on this site. Such intellectual property remains the property of its respective owners, and any references here are made solely for identification or informational purposes, without implying any affiliation, endorsement, or partnership.
We make no representations or warranties, express or implied, regarding the accuracy, completeness, or suitability of any content or products presented. Nothing on this website should be construed as legal, tax, investment, financial, medical, or other professional advice. In addition, no part of this site—including articles or product references—constitutes a solicitation, recommendation, endorsement, advertisement, or offer to buy or sell any securities, franchises, or other financial instruments, particularly in jurisdictions where such activity would be unlawful.
All content is of a general nature and may not address the specific circumstances of any individual or entity. It is not a substitute for professional advice or services. Any actions you take based on the information provided here are strictly at your own risk. You accept full responsibility for any decisions or outcomes arising from your use of this website and agree to release us from any liability in connection with your use of, or reliance upon, the content or products found herein.