
|
BT Group Plc (BT-A.L) Valoración de DCF |
Completamente Editable: Adáptelo A Sus Necesidades En Excel O Sheets
Diseño Profesional: Plantillas Confiables Y Estándares De La Industria
Predeterminadas Para Un Uso Rápido Y Eficiente
Compatible con MAC / PC, completamente desbloqueado
No Se Necesita Experiencia; Fáciles De Seguir
BT Group plc (BT-A.L) Bundle
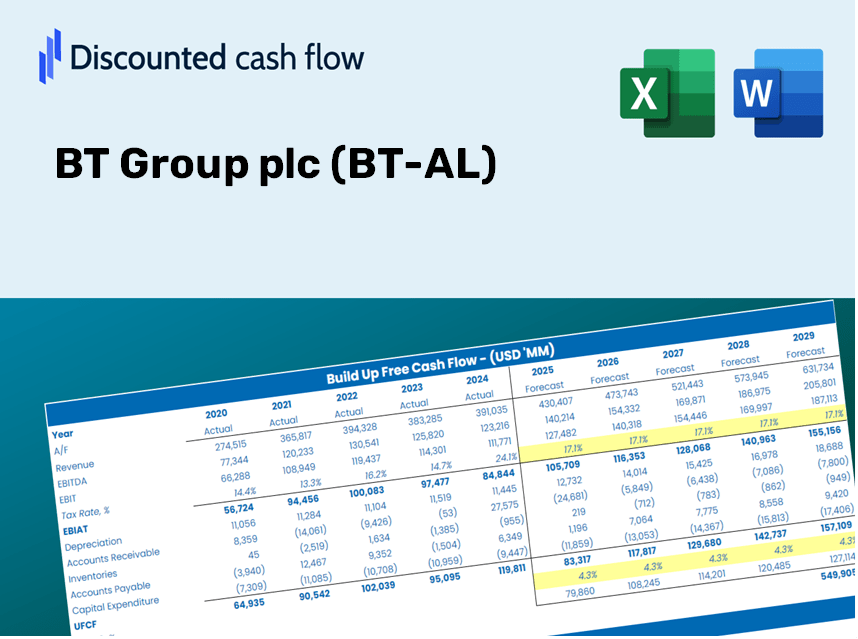
¡Simplifique la valoración del grupo BT PLC (BT-AL) con esta calculadora DCF personalizable! Con el Real BT Group PLC (BT-AL) Financials y las entradas de pronóstico ajustables, puede probar escenarios y descubrir el valor razonable de BT Group PLC (BT-AL) en minutos.
Discounted Cash Flow (DCF) - (USD MM)
| Year | AY1 2021 |
AY2 2022 |
AY3 2023 |
AY4 2024 |
AY5 2025 |
FY1 2026 |
FY2 2027 |
FY3 2028 |
FY4 2029 |
FY5 2030 |
|---|---|---|---|---|---|---|---|---|---|---|
| Revenue | 21,331.0 | 20,850.0 | 20,681.0 | 20,797.0 | 20,358.0 | 20,123.1 | 19,890.9 | 19,661.4 | 19,434.5 | 19,210.3 |
| Revenue Growth, % | 0 | -2.25 | -0.81055 | 0.5609 | -2.11 | -1.15 | -1.15 | -1.15 | -1.15 | -1.15 |
| EBITDA | 6,883.0 | 7,226.0 | 7,474.0 | 6,457.0 | 7,271.0 | 6,834.9 | 6,756.0 | 6,678.1 | 6,601.0 | 6,524.9 |
| EBITDA, % | 32.27 | 34.66 | 36.14 | 31.05 | 35.72 | 33.97 | 33.97 | 33.97 | 33.97 | 33.97 |
| Depreciation | 4,347.0 | 4,405.0 | 4,818.0 | 3,308.0 | 4,883.0 | 4,213.6 | 4,164.9 | 4,116.9 | 4,069.4 | 4,022.4 |
| Depreciation, % | 20.38 | 21.13 | 23.3 | 15.91 | 23.99 | 20.94 | 20.94 | 20.94 | 20.94 | 20.94 |
| EBIT | 2,536.0 | 2,821.0 | 2,656.0 | 3,149.0 | 2,388.0 | 2,621.4 | 2,591.1 | 2,561.2 | 2,531.7 | 2,502.5 |
| EBIT, % | 11.89 | 13.53 | 12.84 | 15.14 | 11.73 | 13.03 | 13.03 | 13.03 | 13.03 | 13.03 |
| Total Cash | 4,652.0 | 3,456.0 | 3,940.0 | 2,311.0 | 2,814.0 | 3,315.1 | 3,276.8 | 3,239.0 | 3,201.7 | 3,164.7 |
| Total Cash, percent | .0 | .0 | .0 | .0 | .0 | .0 | .0 | .0 | .0 | .0 |
| Account Receivables | 3,067.0 | 3,316.0 | 3,682.0 | 3,340.0 | 3,246.0 | 3,223.3 | 3,186.1 | 3,149.4 | 3,113.0 | 3,077.1 |
| Account Receivables, % | 14.38 | 15.9 | 17.8 | 16.06 | 15.94 | 16.02 | 16.02 | 16.02 | 16.02 | 16.02 |
| Inventories | 297.0 | 300.0 | 349.0 | 409.0 | 331.0 | 326.4 | 322.7 | 319.0 | 315.3 | 311.6 |
| Inventories, % | 1.39 | 1.44 | 1.69 | 1.97 | 1.63 | 1.62 | 1.62 | 1.62 | 1.62 | 1.62 |
| Accounts Payable | 4,024.0 | 4,143.0 | 4,196.0 | 4,119.0 | 3,727.0 | 3,909.4 | 3,864.3 | 3,819.7 | 3,775.6 | 3,732.1 |
| Accounts Payable, % | 18.86 | 19.87 | 20.29 | 19.81 | 18.31 | 19.43 | 19.43 | 19.43 | 19.43 | 19.43 |
| Capital Expenditure | -4,903.0 | -4,607.0 | -5,307.0 | -4,969.0 | -4,937.0 | -4,784.7 | -4,729.5 | -4,674.9 | -4,621.0 | -4,567.7 |
| Capital Expenditure, % | -22.99 | -22.1 | -25.66 | -23.89 | -24.25 | -23.78 | -23.78 | -23.78 | -23.78 | -23.78 |
| Tax Rate, % | 20.99 | 20.99 | 20.99 | 20.99 | 20.99 | 20.99 | 20.99 | 20.99 | 20.99 | 20.99 |
| EBITAT | 2,069.3 | 1,830.8 | 2,926.4 | 2,270.1 | 1,886.8 | 2,084.5 | 2,060.4 | 2,036.7 | 2,013.2 | 1,989.9 |
| Depreciation | ||||||||||
| Changes in Account Receivables | ||||||||||
| Changes in Inventories | ||||||||||
| Changes in Accounts Payable | ||||||||||
| Capital Expenditure | ||||||||||
| UFCF | 2,173.3 | 1,495.8 | 2,075.4 | 814.1 | 1,612.8 | 1,722.9 | 1,491.7 | 1,474.5 | 1,457.5 | 1,440.7 |
| WACC, % | 4.75 | 4.33 | 5.22 | 4.51 | 4.69 | 4.7 | 4.7 | 4.7 | 4.7 | 4.7 |
| PV UFCF | ||||||||||
| SUM PV UFCF | 6,648.8 | |||||||||
| Long Term Growth Rate, % | 2.00 | |||||||||
| Free cash flow (T + 1) | 1,469 | |||||||||
| Terminal Value | 54,393 | |||||||||
| Present Terminal Value | 43,229 | |||||||||
| Enterprise Value | 49,878 | |||||||||
| Net Debt | 23,150 | |||||||||
| Equity Value | 26,728 | |||||||||
| Diluted Shares Outstanding, MM | 9,960 | |||||||||
| Equity Value Per Share | 268.35 |
What You Will Receive
- Adjustable Forecast Parameters: Modify key assumptions (growth %, margins, WACC) effortlessly to explore various scenarios.
- Real-Life Financial Data: BT Group plc's (BT-AL) financial metrics pre-filled to facilitate your analysis.
- Automated DCF Results: The model computes Net Present Value (NPV) and intrinsic value automatically.
- Tailorable and Professional: A refined Excel template that adjusts to your valuation requirements.
- Designed for Analysts and Investors: Perfect for evaluating projections, confirming strategies, and enhancing efficiency.
Key Features
- Authentic BT Group Financials: Obtain precise pre-loaded historical data along with forward-looking estimates.
- Adjustable Forecast Parameters: Modify yellow-highlighted fields such as WACC, growth rates, and profit margins.
- Real-Time Calculations: Instant updates for DCF, Net Present Value (NPV), and cash flow assessments.
- Interactive Visualization Dashboard: User-friendly graphs and summaries to clearly display your valuation outcomes.
- Suitable for All Levels: A straightforward and intuitive design tailored for investors, CFOs, and consultants alike.
How It Works
- Step 1: Download the Excel file.
- Step 2: Examine BT Group plc’s pre-filled financial data and projections.
- Step 3: Adjust key inputs such as revenue growth, WACC, and tax rates (highlighted cells).
- Step 4: Observe the DCF model update in real-time as you modify your assumptions.
- Step 5: Evaluate the outputs and leverage the results for your investment choices.
Why Choose the BT Group plc (BT-AL) Calculator?
- Time Efficient: Skip the hassle of building a DCF model from the ground up – it’s immediately available.
- Enhanced Precision: Access to dependable financial data and formulas minimizes valuation errors.
- Completely Customizable: Adjust the model to align with your specific assumptions and forecasts.
- User-Friendly: Intuitive charts and outputs simplify result analysis.
- Trusted by Professionals: Crafted for those who prioritize accuracy and practicality.
Who Should Use This Product?
- Investors: Assess BT Group plc's (BT-AL) valuation prior to making stock transactions.
- CFOs and Financial Analysts: Enhance valuation workflows and evaluate financial forecasts.
- Startup Founders: Discover the valuation methods applied to major public companies like BT Group plc.
- Consultants: Produce comprehensive valuation reports for your clients.
- Students and Educators: Utilize real-time data to practice and instruct on valuation methodologies.
What the Template Contains
- Historical Data: Contains BT Group plc's (BT-AL) previous financial performance and baseline forecasts.
- DCF and Levered DCF Models: Comprehensive templates for determining BT Group plc's (BT-AL) intrinsic value.
- WACC Sheet: Pre-calculated metrics for the Weighted Average Cost of Capital.
- Editable Inputs: Adjust essential drivers such as growth rates, EBITDA percentages, and CAPEX assumptions.
- Quarterly and Annual Statements: A thorough analysis of BT Group plc's (BT-AL) financials.
- Interactive Dashboard: Dynamic visualization of valuation outcomes and projections.
Disclaimer
All information, articles, and product details provided on this website are for general informational and educational purposes only. We do not claim any ownership over, nor do we intend to infringe upon, any trademarks, copyrights, logos, brand names, or other intellectual property mentioned or depicted on this site. Such intellectual property remains the property of its respective owners, and any references here are made solely for identification or informational purposes, without implying any affiliation, endorsement, or partnership.
We make no representations or warranties, express or implied, regarding the accuracy, completeness, or suitability of any content or products presented. Nothing on this website should be construed as legal, tax, investment, financial, medical, or other professional advice. In addition, no part of this site—including articles or product references—constitutes a solicitation, recommendation, endorsement, advertisement, or offer to buy or sell any securities, franchises, or other financial instruments, particularly in jurisdictions where such activity would be unlawful.
All content is of a general nature and may not address the specific circumstances of any individual or entity. It is not a substitute for professional advice or services. Any actions you take based on the information provided here are strictly at your own risk. You accept full responsibility for any decisions or outcomes arising from your use of this website and agree to release us from any liability in connection with your use of, or reliance upon, the content or products found herein.