
|
Valoración DCF de BrightView Holdings, Inc. (BV) |
Completamente Editable: Adáptelo A Sus Necesidades En Excel O Sheets
Diseño Profesional: Plantillas Confiables Y Estándares De La Industria
Predeterminadas Para Un Uso Rápido Y Eficiente
Compatible con MAC / PC, completamente desbloqueado
No Se Necesita Experiencia; Fáciles De Seguir
BrightView Holdings, Inc. (BV) Bundle
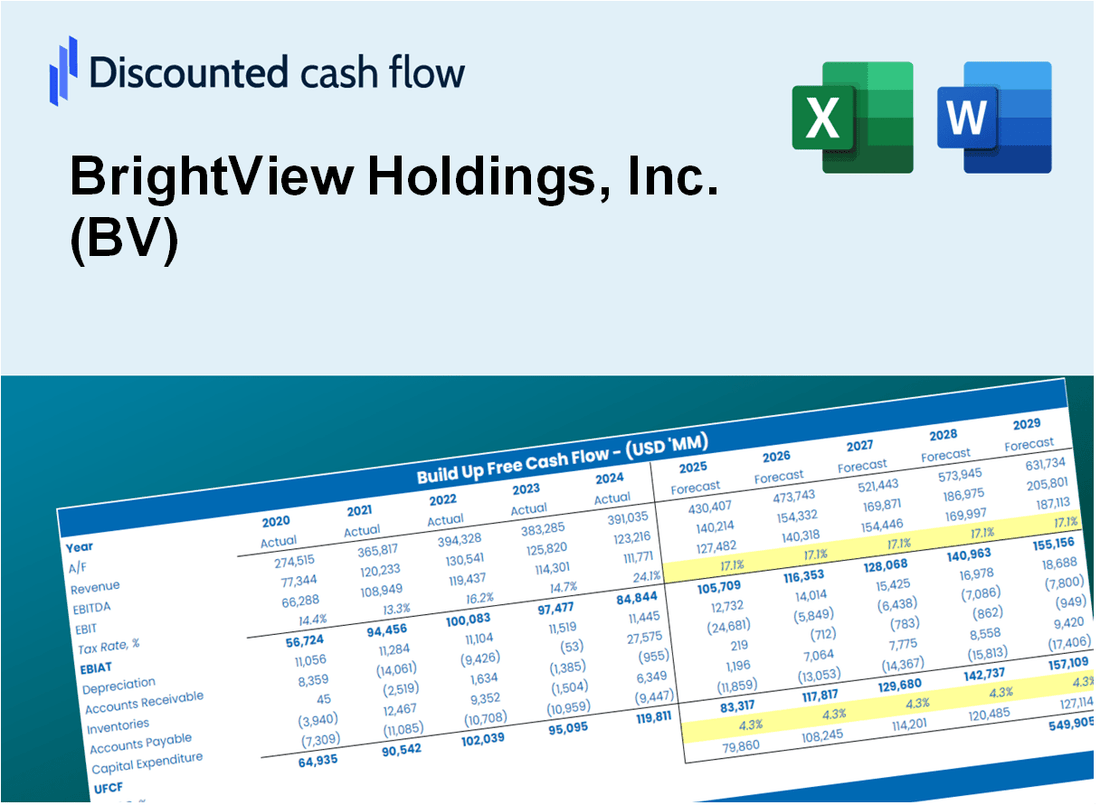
¡Simplifique la valoración de BrightView Holdings, Inc. (BV) con esta calculadora DCF personalizable! Con las finanzas de BrightView reales y las entradas de pronóstico ajustables, puede probar escenarios y descubrir el valor razonable de BrightView en minutos.
What You Will Get
- Pre-Filled Financial Model: BrightView’s actual data facilitates accurate DCF valuation.
- Full Forecast Control: Modify revenue growth, margins, WACC, and other essential drivers.
- Instant Calculations: Automatic updates allow you to view results in real-time as you make adjustments.
- Investor-Ready Template: A polished Excel file crafted for high-quality valuation.
- Customizable and Reusable: Designed for adaptability, enabling repeated use for in-depth forecasts.
Key Features
- Comprehensive Historical Data: BrightView Holdings, Inc. (BV) offers extensive historical financial statements and pre-populated forecasts.
- Customizable Parameters: Alter WACC, tax rates, revenue growth, and EBITDA margins to suit your analysis.
- Real-Time Valuation: Instantly view the recalculated intrinsic value of BrightView Holdings, Inc. (BV).
- Intuitive Visualizations: Dashboard charts present valuation results and essential metrics clearly.
- Designed for Precision: A robust tool tailored for analysts, investors, and finance professionals.
How It Works
- Step 1: Download the prebuilt Excel template with BrightView Holdings, Inc.'s (BV) data included.
- Step 2: Explore the pre-filled sheets and understand the key metrics.
- Step 3: Update forecasts and assumptions in the editable yellow cells (WACC, growth, margins).
- Step 4: Instantly view recalculated results, including BrightView Holdings, Inc.'s (BV) intrinsic value.
- Step 5: Make informed investment decisions or generate reports using the outputs.
Why Choose BrightView Holdings, Inc. (BV) Calculator?
- Save Time: Skip the hassle of building a model from the ground up – it’s ready for immediate use.
- Enhance Accuracy: Dependable financial data and formulas minimize valuation errors.
- Completely Customizable: Adjust the model to align with your unique assumptions and forecasts.
- User-Friendly: Intuitive charts and outputs simplify the analysis of results.
- Endorsed by Professionals: Crafted for experts who prioritize precision and functionality.
Who Should Use BrightView Holdings, Inc. (BV)?
- Landscape Management Students: Explore industry-specific valuation methods and apply them to real-world scenarios.
- Researchers: Integrate advanced financial models into your studies or academic projects.
- Investors: Validate your investment hypotheses and evaluate the financial performance of BrightView Holdings, Inc. (BV).
- Financial Analysts: Enhance your analysis with a customizable DCF model tailored for the landscaping industry.
- Entrepreneurs: Understand how public companies like BrightView Holdings, Inc. (BV) are assessed and valued in the market.
What the Template Contains
- Pre-Filled DCF Model: BrightView Holdings, Inc. (BV)’s financial data preloaded for immediate use.
- WACC Calculator: Detailed calculations for Weighted Average Cost of Capital.
- Financial Ratios: Evaluate BrightView Holdings, Inc. (BV)’s profitability, leverage, and efficiency.
- Editable Inputs: Change assumptions such as growth, margins, and CAPEX to fit your scenarios.
- Financial Statements: Annual and quarterly reports to support detailed analysis.
- Interactive Dashboard: Easily visualize key valuation metrics and results.
Disclaimer
All information, articles, and product details provided on this website are for general informational and educational purposes only. We do not claim any ownership over, nor do we intend to infringe upon, any trademarks, copyrights, logos, brand names, or other intellectual property mentioned or depicted on this site. Such intellectual property remains the property of its respective owners, and any references here are made solely for identification or informational purposes, without implying any affiliation, endorsement, or partnership.
We make no representations or warranties, express or implied, regarding the accuracy, completeness, or suitability of any content or products presented. Nothing on this website should be construed as legal, tax, investment, financial, medical, or other professional advice. In addition, no part of this site—including articles or product references—constitutes a solicitation, recommendation, endorsement, advertisement, or offer to buy or sell any securities, franchises, or other financial instruments, particularly in jurisdictions where such activity would be unlawful.
All content is of a general nature and may not address the specific circumstances of any individual or entity. It is not a substitute for professional advice or services. Any actions you take based on the information provided here are strictly at your own risk. You accept full responsibility for any decisions or outcomes arising from your use of this website and agree to release us from any liability in connection with your use of, or reliance upon, the content or products found herein.