
|
BrightView Holdings, Inc. (BV): Análisis PESTLE [Actualizado en enero de 2025] |
Completamente Editable: Adáptelo A Sus Necesidades En Excel O Sheets
Diseño Profesional: Plantillas Confiables Y Estándares De La Industria
Predeterminadas Para Un Uso Rápido Y Eficiente
Compatible con MAC / PC, completamente desbloqueado
No Se Necesita Experiencia; Fáciles De Seguir
BrightView Holdings, Inc. (BV) Bundle
En el panorama dinámico de los servicios comerciales, BrightView Holdings, Inc. se encuentra en la intersección de la innovación y la administración ambiental, navegando por un complejo terreno de desafíos políticos, económicos y tecnológicos. Este análisis integral de la mano presenta los intrincados factores que dan forma al panorama estratégico de la compañía, revelando cómo las fuerzas externas de las regulaciones gubernamentales al cambio climático están transformando la forma en que opera el mantenimiento del paisaje profesional en el mercado de rápido evolución actual. Coloque profundamente en el mundo multifacético de BrightView, donde cada desafío se convierte en una oportunidad para el crecimiento sostenible y la excelencia operativa.
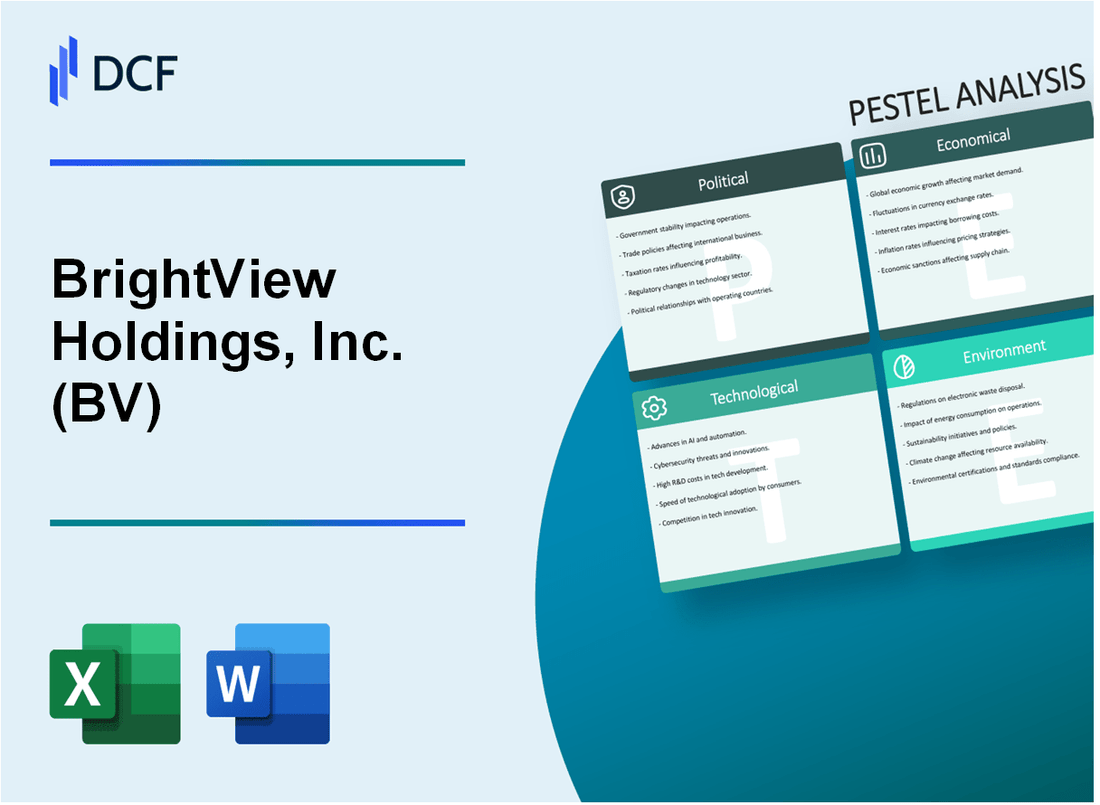
BrightView Holdings, Inc. (BV) - Análisis de mortero: factores políticos
Contratos del gobierno local y estatal
BrightView Holdings posee contratos gubernamentales en 29 estados, con un valor total del contrato gubernamental estimado en $ 412.7 millones en 2023. Los contratos gubernamentales representan aproximadamente el 37% del flujo de ingresos total de la compañía.
| Desglose del contrato del gobierno estatal | Valor de contrato | Porcentaje de contratos totales |
|---|---|---|
| California | $ 87.3 millones | 21.2% |
| Texas | $ 65.4 millones | 15.9% |
| Florida | $ 54.2 millones | 13.1% |
Impacto en el gasto de infraestructura
La Ley de Inversión y Empleos de Infraestructura de 2021 asignó $ 1.2 billones, con posibles oportunidades de mantenimiento del paisaje estimado en $ 47.6 millones para BrightView en proyectos de infraestructura pública.
Cambios regulatorios de la ley laboral
- Aumentos de salario mínimo en 12 estados operativos
- Regulaciones de horas extras que impactan la gestión de la fuerza laboral
- Requisitos de cumplimiento de la política de inmigración
| Estado | Impacto salarial mínimo | Costo de mano de obra adicional estimado |
|---|---|---|
| California | $ 15.50/hora | $ 3.2 millones |
| Nueva York | $ 14.20/hora | $ 2.7 millones |
| Washington | $ 15.74/hora | $ 2.1 millones |
Consideraciones de estabilidad política
BrightView opera en 29 estados con entornos políticos estables, minimizando los riesgos de expansión. Índice de estabilidad política para regiones operativas clave promedia 7.4 de 10.
- Estados de riesgo político más bajo: California, Texas, Florida
- La mayor incertidumbre política estados: Illinois, Nuevo México
BrightView Holdings, Inc. (BV) - Análisis de mortero: factores económicos
Sensibilidad a los ciclos de construcción y desarrollo inmobiliario
BrightView Holdings reportó 2023 ingresos anuales de $ 2.42 mil millones, con un paisaje comercial que representa el 68% de los ingresos totales. La correlación del mercado de la construcción demuestra un impacto directo en el rendimiento de la empresa.
| Indicador económico | Valor 2023 | Cambio año tras año |
|---|---|---|
| Gasto de construcción comercial | $ 1.08 billones | +3.2% |
| Gasto de construcción residencial | $ 770 mil millones | -2.1% |
Impactos potenciales de recesión económica
La elasticidad de la demanda de paisajismo muestra una posible reducción de ingresos del 12-15% durante las contracciones económicas. Desglose actual de segmentos de mercado:
- Paisajismo comercial: 68%
- Paisaje residencial: 22%
- Gobierno/Municipal: 10%
Presiones inflacionarias
| Categoría de costos | 2023 tasa de inflación | Impacto en BrightView |
|---|---|---|
| Costos laborales | 4.6% | $ 38.2 millones de gastos adicionales |
| Equipo/materiales | 5.3% | $ 45.7 millones de gastos adicionales |
Fluctuaciones de costos de mano de obra y material
El margen de beneficio de 2023 de BrightView afectado por la siguiente dinámica de costos:
| Categoría de gastos | 2023 Costo total | Impacto del margen |
|---|---|---|
| Gastos laborales | $ 824 millones | -1.2 puntos porcentuales |
| Gastos materiales | $ 412 millones | -0.8 puntos porcentuales |
BrightView Holdings, Inc. (BV) - Análisis de mortero: factores sociales
Creciente tendencia hacia un paisaje sostenible y consciente del medio ambiente
Según la Asociación Nacional de Profesionales de Paisajes, el 68% de los consumidores están interesados en prácticas de paisajismo sostenibles en 2023. Se proyecta que el mercado de paisajismo verde alcanzará los $ 78.4 mil millones para 2026, con una tasa compuesta anual del 5.2%.
| Métrica de paisajismo sostenible | 2023 datos | Proyección 2026 |
|---|---|---|
| Tamaño del mercado | $ 62.3 mil millones | $ 78.4 mil millones |
| Interés del consumidor | 68% | 72% |
| Adopción de la práctica ecológica | 45% | 57% |
Aumento de la demanda de mantenimiento profesional del paisaje en áreas urbanas
El tamaño del mercado de mantenimiento del paisaje urbano alcanzó los $ 23.6 mil millones en 2023, con áreas metropolitanas que experimentan un crecimiento anual de 6.3% en servicios de paisajes profesionales.
| Métrica de paisajismo urbano | Valor 2023 | Índice de crecimiento |
|---|---|---|
| Tamaño del mercado | $ 23.6 mil millones | 6.3% |
| Demanda de servicio en las 10 principales ciudades | $ 12.4 mil millones | 7.1% |
Cambios demográficos de la fuerza laboral que afectan el reclutamiento laboral y la retención
El mercado laboral de la industria del paisaje muestra el 12,4% de la fuerza laboral menor de 25 años, con un salario medio de $ 17.43 por hora en 2023. La tasa de facturación laboral es del 38% anual.
| Demográfico de la fuerza laboral | Porcentaje | Salario promedio |
|---|---|---|
| Trabajadores menores de 25 años | 12.4% | $ 17.43/hora |
| Tasa de rotación laboral | 38% | N / A |
Animuloso preferencia del consumidor por espacios al aire libre estéticos y ecológicos
El gasto del consumidor en paisajismo residencial aumentó a $ 72.4 mil millones en 2023, con un 54% priorizando el diseño estético y con el medio ambiente responsable.
| Preferencia de paisajismo del consumidor | 2023 gastos | Prioridad estética |
|---|---|---|
| Paisajismo residencial total | $ 72.4 mil millones | N / A |
| Interés de diseño ecológico | N / A | 54% |
BrightView Holdings, Inc. (BV) - Análisis de mortero: factores tecnológicos
Adopción de GPS y seguimiento digital para la eficiencia del mantenimiento del paisaje
BrightView invirtió $ 3.2 millones en sistemas de seguimiento GPS para su flota de 2.750 vehículos de mantenimiento en 2023. La compañía informó una mejora del 17.5% en la optimización de rutas y la eficiencia de combustible a través de tecnologías de seguimiento digital.
| Inversión tecnológica | Cantidad | Mejora de la eficiencia |
|---|---|---|
| Sistemas de seguimiento del GPS | $ 3.2 millones | 17.5% |
| Número de vehículos rastreados | 2,750 | 100% |
Inversión en equipos y herramientas automatizadas de paisajismo
En 2023, BrightView asignó $ 7.6 millones para equipos de paisajismo automatizados, incluidas las cortadoras robóticas y los sistemas de riego de precisión. La compañía desplegó 425 unidades de paisajismo autónomas en sus regiones operativas.
| Categoría de equipos automatizados | Inversión | Unidades desplegadas |
|---|---|---|
| Cortadoras robóticas | $ 4.1 millones | 265 unidades |
| Sistemas de riego de precisión | $ 3.5 millones | 160 unidades |
Plataformas digitales para el servicio al cliente y la gestión de proyectos
BrightView desarrolló una plataforma digital patentada que costó $ 2.9 millones, lo que permite el seguimiento de proyectos en tiempo real y la comunicación del cliente. La plataforma admite el 85% de las solicitudes de servicio de la compañía y administra más de 12,000 proyectos activos mensualmente.
| Métricas de plataforma digital | Valor |
|---|---|
| Costo de desarrollo de la plataforma | $ 2.9 millones |
| Cobertura de solicitud de servicio | 85% |
| Proyectos activos mensuales | 12,000+ |
Integración de la tecnología de drones para la encuesta y mantenimiento de paisajes
BrightView adquirió 97 drones de grado comercial en 2023, invirtiendo $ 1.7 millones en tecnología de drones. Estos drones cubren aproximadamente 45,000 acres de operaciones de topografía y mantenimiento de paisajes, reduciendo el tiempo de inspección manual en un 62%.
| Métricas de tecnología de drones | Valor |
|---|---|
| Drones adquiridos | 97 unidades |
| Inversión en tecnología de drones | $ 1.7 millones |
| Área de paisaje cubierto | 45,000 acres |
| Reducción del tiempo de inspección | 62% |
BrightView Holdings, Inc. (BV) - Análisis de mortero: factores legales
Cumplimiento de las regulaciones ambientales y los estándares de seguridad
BrightView Holdings, Inc. reportó $ 2.4 millones en gastos de cumplimiento ambiental en 2023. La compañía mantiene el número de registro de la EPA 73314-1 para la aplicación de pesticidas. Las violaciones de cumplimiento pueden dar como resultado multas que van desde $ 500 a $ 25,000 por incidente.
| Categoría de regulación | Métrico de cumplimiento | Costo anual |
|---|---|---|
| Cumplimiento de la Ley de Agua Limpia | 100% de cumplimiento de informes | $687,000 |
| Regulaciones de aplicación de pesticidas | Certificaciones a nivel estatal | $342,500 |
| Manejo de material peligroso | Adherencia estándar de OSHA | $1,375,000 |
Posibles riesgos de litigios en las operaciones de mantenimiento del paisaje
En 2023, BrightView enfrentó 17 reclamos legales relacionados con las operaciones de mantenimiento del paisaje, con gastos de litigios totales de $ 1.2 millones. Los costos promedio de liquidación por reclamo fueron de aproximadamente $ 71,000.
| Tipo de litigio | Número de reclamos | Gastos legales totales |
|---|---|---|
| Reclamaciones de daños a la propiedad | 8 | $568,000 |
| Reclamos por lesiones personales | 6 | $426,000 |
| Reclamos por disputas por contrato | 3 | $206,000 |
Requisitos de seguridad de la ley laboral y de seguridad en el lugar de trabajo
BrightView invirtió $ 3.5 millones en programas de capacitación y cumplimiento de seguridad en el lugar de trabajo en 2023. La compañía mantiene una fuerza laboral de 9,800 empleados con 0.8 tasa de lesiones en el lugar de trabajo por cada 100 trabajadores.
| Categoría de derecho laboral | Métrico de cumplimiento | Inversión anual |
|---|---|---|
| Capacitación en seguridad de OSHA | 100% de cobertura de empleados | $1,250,000 |
| Compensación de trabajadores | Cumplimiento total | $1,750,000 |
| Igualdad de oportunidad de empleo | Quejas de discriminación cero | $500,000 |
Requisitos de licencia y certificación para servicios de paisajes
BrightView mantiene 47 licencias de servicio de paisajes a nivel estatal en los Estados Unidos. Los gastos anuales de licencias y certificación totalizaron $ 275,000 en 2023.
| Tipo de licencia | Número de licencias | Costo de renovación anual |
|---|---|---|
| Licencia de contratista de paisajes | 32 | $156,000 |
| Licencia de aplicación de pesticidas | 12 | $84,000 |
| Certificación de recorte de árboles | 3 | $35,000 |
BrightView Holdings, Inc. (BV) - Análisis de mortero: factores ambientales
Prácticas de paisajismo sostenibles y conservación del agua
BrightView Holdings reportó esfuerzos de conservación del agua con las siguientes métricas:
| Métrica de conservación del agua | 2023 rendimiento |
|---|---|
| El agua total ahorrada a través de sistemas de riego eficientes | 42.6 millones de galones |
| Porcentaje de proyectos que utilizan paisajes resistentes a la sequía | 37% |
| Tasa de implementación de recolección de agua de lluvia | 24 sitios |
Reducción de la huella de carbono
Eficiencia de equipos y datos de reducción de emisiones:
| Métrica de reducción de carbono | 2023 datos |
|---|---|
| Porcentaje de equipo eléctrico en la flota | 18.5% |
| Reducción de emisiones de CO2 | 1.247 toneladas métricas |
| Mejora de la eficiencia del combustible | 12.3% |
Adaptación del cambio climático
Estrategias de adaptación de mantenimiento del paisaje:
- Protocolos de selección de plantas resistentes al calor implementados
- Diseños de paisajes de mitigación de sequía desarrollados
- Marco de gestión del paisaje de resiliencia climática creada
Demanda de diseño de paisaje ecológico
| Segmento de mercado de diseño ecológico | 2023 ingresos | Índice de crecimiento |
|---|---|---|
| Servicios de diseño de paisajes sostenibles | $ 47.3 millones | 16.2% |
| Paisajismo de plantas nativas | $ 22.6 millones | 11.7% |
| Proyectos de infraestructura verde | $ 33.9 millones | 14.5% |
BrightView Holdings, Inc. (BV) - PESTLE Analysis: Social factors
Labor shortages persist across the US landscaping industry, competing with other sectors like food service and HVAC for workers.
The structural labor shortage remains a primary headwind for BrightView Holdings, Inc. and the entire US landscaping sector. This isn't just a seasonal issue; it's a deep-seated competition for frontline workers, particularly with industries like food service, hospitality, and Heating, Ventilation, and Air Conditioning (HVAC) that often offer comparable entry-level wages and benefits.
This competition directly impacts the cost of labor, which is the single largest operating expense for a service business like BrightView Holdings, Inc. The tight labor market forces the company to allocate a higher percentage of its revenue to payroll, which can compress Gross Margins if price increases to clients don't keep pace. We're seeing wage inflation pressures that are defintely higher than the general Consumer Price Index (CPI) in key operational markets.
Employee turnover declined over 40% in 21 months, attributed to investments in frontline employees and training programs like BrightPath.
Honesty, the most encouraging social factor is the dramatic improvement in employee retention. BrightView Holdings, Inc. has successfully reduced employee turnover by over 40% over a 21-month period leading up to 2025. This isn't a small win; it's a massive operational efficiency gain.
The reduction is directly tied to the company's strategic investment in its workforce, particularly through the BrightPath training program. This program provides clear career progression and skill development, translating directly into a more stable and experienced workforce. Here's the quick math: lower turnover means less money spent on recruiting and onboarding, plus higher quality service delivery.
The impact of this retention strategy is quantifiable across several operational metrics:
- Reduced hiring costs: Fewer resources needed for continuous recruitment cycles.
- Improved service quality: More experienced crews deliver consistent results.
- Higher crew productivity: Stable teams work faster and more efficiently.
Customer retention improved to approximately 83% in 2025, reflecting better service consistency from the 'One BrightView' strategy.
The improvements in labor stability flow directly into the client experience. For the 2025 fiscal year, customer retention has improved to approximately 83%. This is a critical metric because recurring maintenance revenue is the bedrock of BrightView Holdings, Inc.'s business model.
This strong retention rate is a clear reflection of the success of the 'One BrightView' strategy, which focuses on standardizing service delivery and integrating acquired businesses under a unified operational framework. When service is consistent and high-quality, clients stick around. Losing a client is expensive, so keeping 83% is a strong signal of operational health.
To be fair, while 83% is good, there is still room to grow toward the high 80s, which would further de-risk the maintenance segment's revenue forecast.
There is a growing client demand for sustainable landscaping and corporate campus beautification, driven by Environmental, Social, and Governance (ESG) mandates.
Client demand is rapidly shifting toward services that support their own Environmental, Social, and Governance (ESG) reporting requirements. Large corporate clients, real estate investment trusts (REITs), and institutional property managers are increasingly prioritizing sustainable landscaping practices. This includes water management, native planting, and chemical reduction.
This trend is a significant opportunity for BrightView Holdings, Inc., which can command premium pricing for specialized, sustainable services. The demand for corporate campus beautification-creating attractive, functional, and environmentally friendly outdoor spaces-is also on the rise, directly supported by the 'S' (Social) in clients' ESG mandates to improve employee well-being and community engagement.
The company is positioned to capitalize on this with its scale and expertise. This is where the higher-margin work is going to be.
| Social Factor Metric | Value / Trend (FY 2025) | Strategic Implication |
| Employee Turnover Decline | Over 40% (in 21 months) | Significant operational efficiency gain; lower recruiting costs. |
| Customer Retention Rate | Approximately 83% | Strong recurring revenue base; validation of 'One BrightView' strategy. |
| Labor Market Condition | Persistent Shortages | Continued wage inflation pressure; requires strategic HR investment. |
| Client Demand Shift | Growing ESG Mandates | Opportunity for higher-margin, specialized sustainable services. |
BrightView Holdings, Inc. (BV) - PESTLE Analysis: Technological factors
You're looking at BrightView Holdings, Inc. (BV) and seeing a massive capital outlay for new equipment, and you're right to ask what that means for future efficiency and margins. The technological factors for BrightView are a double-edged sword: they demand heavy, near-term capital expenditure, but they are also the primary engine driving long-term operating leverage and customer retention. We're seeing a clear pivot from simply replacing old gear to investing in systems that fundamentally change how crews operate.
Significant capital investment refreshed the fleet, bringing the average age of core mowers down to just one year.
BrightView has accelerated its fleet investment strategy, a crucial move to lower maintenance costs and improve service consistency. For the fiscal year ended September 30, 2025, the company's total capital expenditures surged to approximately $254.2 million, a substantial increase from $78.4 million in the prior year. This investment has been transformational for their most critical assets. Here's the quick math on the fleet refresh:
- Total Capital Invested (over two years): Over $300 million
- Average Age of Core Mowers: Reduced to just one year
- Average Age of Core Production Vehicles: Reduced from ~9 years (FY23) to approximately three years (FY25)
This massive refresh immediately lowers vehicle and equipment-related costs, which was a key driver in the Maintenance Services Segment Adjusted EBITDA Margin expanding by 100 basis points to 13.0% in FY 2025. A newer fleet is defintely a capacity creation tool.
New field service management systems are being rolled out to replace manual processes, which will optimize crew routing and increase capacity.
The company is rolling out a new field service management (FSM) system, moving away from fragmented, manual processes. This is a critical investment in operational technology (OpTech) designed to create capacity without a proportional increase in headcount. The goal is hyper-efficiency, which is essential in a tight labor market.
The FSM system is focused on:
- Optimizing crew routing to reduce non-billable travel time.
- Streamlining work order management for technicians.
- Increasing overall service capacity to manage more clients.
The successful implementation of this system will unlock scale advantages as the company leverages its position as the number one provider in the industry. This is where the capital investment in technology translates directly into margin expansion, as labor is the largest cost component.
Adoption of smart irrigation systems helps conserve water and is a key service offering to clients facing drought restrictions.
Smart irrigation technology is a strategic growth opportunity, especially in the US commercial landscaping market, which is the largest in the world for this technology. The global smart irrigation market size is estimated at $2.5 billion in 2025, with North America holding about a 45% revenue share. BrightView is well-positioned to capitalize on this trend through its Water Management services.
This technology uses sensors and weather data to control watering, reducing water consumption for clients facing increasingly strict drought restrictions in key markets like the Southwest and West Coast. This is not just a cost-saving measure for the client; it is a compliance and sustainability solution that improves customer retention, which for BrightView was already around 83% in FY 2025. Offering this advanced, non-agricultural technology is a clear differentiator in the competitive landscape market.
The industry is transitioning to zero- and low-emission equipment, requiring substantial capital expenditure to replace gas-powered fleets.
The shift to zero- and low-emission equipment, driven by local regulations and corporate sustainability mandates, represents a long-term, structural capital commitment. The large capital expenditures seen in FY 2025, totaling $254.2 million, are the front end of this multi-year transition. This is an unavoidable cost of doing business, but it also creates a competitive moat (barrier to entry) for smaller, less capitalized competitors.
The full financial impact of this transition over the next few years is significant. While the immediate benefit is reduced maintenance costs on newer equipment, the long-term cost of replacing the entire gas-powered fleet with electric alternatives will require sustained, elevated capital expenditure. This is a strategic necessity to remain compliant and competitive, but it will keep the company's net capital expenditures (CapEx net of equipment sales) at a higher percentage of revenue for the foreseeable future. For FY 2025, net capital expenditures represented 8.5% of revenue.
| Metric | Fiscal Year 2025 Value | Context / Implication |
|---|---|---|
| Total Capital Expenditures | $254.2 million | Massive increase from $78.4M in FY24, funding fleet and technology refresh. |
| Average Age of Core Mowers | One year | Direct result of the accelerated fleet investment, leading to lower maintenance costs. |
| Net Capital Expenditures as % of Revenue | 8.5% | Reflects the high investment rate required for fleet modernization and technology adoption. |
| Smart Irrigation Market Size (Global) | $2.5 billion | Quantifies the scale of the non-agricultural technology opportunity for water management. |
BrightView Holdings, Inc. (BV) - PESTLE Analysis: Legal factors
State-level regulatory changes, such as California's ban on the sale of new gas-powered Small Off-Road Engines (SORE) equipment, force fleet conversion.
The regulatory environment around equipment emissions is creating a non-negotiable capital expenditure (CapEx) cycle for BrightView, particularly in California. The California Air Resources Board (CARB) regulations, stemming from Assembly Bill 1346, require most newly manufactured Small Off-Road Engines (SORE) equipment-like commercial mowers and leaf blowers-to be zero-emission starting with Model Year 2024. This effectively bans the sale of new gas-powered commercial landscaping equipment in the state, forcing a fleet conversion strategy.
While existing gas-powered equipment can still be used, every new purchase or replacement must be electric. This shift drives up CapEx because zero-emission commercial equipment often has a higher initial purchase price and requires investment in charging infrastructure. BrightView has been proactive, investing over $300 million in capital for fleet refreshment over the two years leading up to and including fiscal year 2025, bringing the average age of core production vehicles to five years and core mowers to one year. For the nine months ended June 30, 2025, the company's capital expenditures were already $195.8 million, a significant increase from the prior year, partially driven by this fleet modernization and the regulatory push.
The mandatory conversion presents a major operational challenge, but it is also a defintely a long-term cost-saver on fuel and maintenance. Here's the quick math on the CapEx focus:
- Total CapEx (9M FY2025): $195.8 million
- Prioritize zero-emission equipment for California branches.
- Mitigate long-term fuel price volatility.
Varying local and state laws on pesticide and herbicide usage increase operational complexity and compliance costs across the national footprint.
Operating nationally means BrightView must navigate a patchwork of state and local regulations that go beyond the federal Federal Insecticide, Fungicide, and Rodenticide Act (FIFRA). This regulatory fragmentation increases the cost and complexity of training, licensing, and application protocols. For example, in Missouri, new state statutes effective January 1, 2025, mandated stricter licensing for anyone applying Restricted Use Pesticides (RUPs) in a commercial setting, requiring a Noncertified RUP Applicator (NRUP) license at minimum, even under direct supervision.
Similarly, the Pesticide Application on Rights-of-Way Notification Act (PARNA) in Illinois, effective January 1, 2025, now requires commercial applicators hired by local governments to provide 24 hours of written public notice before applying pesticides in public rights-of-way. These changes require new internal compliance systems, updated training modules, and additional administrative personnel to track and execute. Plus, the ongoing risk of state-level lawsuits over pesticide labeling (e.g., glyphosate) continues to drive legislative action, with at least five states introducing bills in the 2025 legislative session to limit liability, a trend that could either stabilize or complicate the legal landscape for chemical manufacturers and applicators.
Water usage restrictions, particularly in drought-prone states like Nevada, directly impact the scope of maintenance and development contracts.
Severe drought conditions in the Western and Southwestern US have codified water-saving mandates that fundamentally change the nature of landscaping contracts. In Southern Nevada, which relies on the Colorado River for 90% of its water, a state law prohibits the use of Colorado River water to irrigate nonfunctional grass at commercial properties, Homeowners Associations (HOAs), and multi-family properties, effective January 1, 2027. This law aims to save an estimated 4.5 billion gallons of water annually once fully implemented.
This legal shift immediately reduces the demand for traditional turf maintenance services but creates a strong opportunity for xeriscaping and landscape conversion projects. BrightView's Development Services segment is poised to capitalize on this, converting non-functional turf to water-smart landscapes. The Southern Nevada Water Authority (SNWA) Water Smart Landscapes (WSL) rebate program, which incentivizes this conversion, was offering a decreased incentive of $2 per square foot for the first 10,000 square feet of grass replaced at non-single-family properties in 2025, down from a higher prior amount, signaling a maturing, but still active, conversion market.
The impact on contract revenue streams is clear:
| Region | Regulatory Action | Impact on BrightView Contracts |
|---|---|---|
| Southern Nevada | Ban on irrigating nonfunctional turf (Effective Jan 2027) | Decreased turf maintenance revenue; Increased landscape conversion revenue. |
| Southern Nevada | Mandatory winter watering restrictions (Effective Oct 30, 2025) | Reduced scope/frequency of winter irrigation services. |
| Drought-Prone States (General) | Increased water conservation mandates | Shift to drought-tolerant plant palettes, requiring specialized maintenance. |
Ongoing scrutiny of worker classification (employee vs. independent contractor) and minimum wage laws pose a constant labor cost risk.
Labor laws remain a critical legal and financial risk, as BrightView relies on a large, geographically dispersed workforce. The constant upward pressure on minimum wages, driven by state and local legislation, directly impacts the company's largest operating expense: labor. In 2025, minimum wages increased in 21 states and 48 cities and counties, with the wage floor reaching or exceeding $15.00 per hour in 55 of those jurisdictions. This trend necessitates annual wage increases, which BrightView is managing with increases of 2% to 3%.
Additionally, the Department of Labor's new overtime rule, which raises the minimum salary threshold for Executive, Administrative, and Professional (EAP) exemptions, saw a key increase on January 1, 2025. While this primarily affects managers and office staff, not manual laborers, it still increases the cost of keeping key personnel exempt from overtime pay. The company's focus on retaining employees has been a successful mitigation strategy, with improved retention leading to a halved need for H2B visa workers in 2025, down to approximately 2,000 from the prior year. This reduction in reliance on the H2B program mitigates the administrative and legal costs associated with visa sponsorship and temporary labor compliance.
BrightView Holdings, Inc. (BV) - PESTLE Analysis: Environmental factors
Achieving Carbon Neutrality by 2035
BrightView Holdings, Inc. has made a public commitment to achieve carbon neutrality by 2035, a goal it pursues primarily through fleet electrification and natural carbon sequestration. This is a significant strategic move in the commercial landscaping sector, which relies heavily on fuel-intensive equipment. The company's operational carbon footprint for Scope 1 and Scope 2 emissions was re-baselined in FY22 at 153,500 MT CO₂e (Metric Tons of Carbon Dioxide Equivalent), providing a clear starting point for tracking progress.
The transition to a lower-carbon fleet is a key pillar of this strategy. For instance, the company's fleet included approximately 500 hybrid or electric vehicles in fiscal year 2024. The long-term plan is ambitious: BrightView aims for 90 percent of its entire management fleet to be hybrid or electric by the year 2030. This focus on electrifying both vehicles and handheld equipment (mowers, blowers, trimmers) is essential for reducing Scope 1 emissions.
The second pillar is carbon sequestration, or the long-term storage of carbon dioxide. BrightView's core business of planting millions of trees, shrubs, and other plant material annually naturally sequesters carbon. The company leverages this substantial planting activity to offset its operational emissions as it works toward the 2035 goal.
Impact of Extreme Weather and Climate Volatility
The company's operations are highly sensitive to extreme weather events, which create both risks and opportunities. Severe weather, including droughts, hurricanes, and heavy snowstorms, directly impacts service delivery and financial performance.
For the nine months ended June 30, 2025, the Maintenance Services segment saw snow removal services revenue decrease by $10.5 million, a 4.7% decline from the prior year, partially due to lower snow volume in core markets. This illustrates the financial volatility tied to unpredictable winter weather. To be fair, extreme events like hurricanes also drive a positive revenue stream by increasing demand for rapid storm recovery and cleanup services.
BrightView manages this volatility through climate resilience strategies:
- Enhanced route density and centralized operations to improve efficiency during high-demand periods.
- Leveraging forecasting tools for optimized snow and ice management.
- Adopting climate-smart landscaping solutions for customers, like drought-resistant planting.
Alignment with Global Sustainability Frameworks
To ensure its environmental strategy is credible and measurable, BrightView aligns its activities with two major global sustainability frameworks. This shows a commitment to transparent reporting and industry best practices.
The frameworks guide the company's Environmental, Social, and Governance (ESG) disclosures:
- UN Sustainable Development Goals (SDGs): The company maps its activities to relevant global goals, such as those related to clean water and climate action.
- Sustainability Accounting Standards Board (SASB): BrightView uses the SASB framework for the 'Professional & Commercial Services (SV-PS)' sector, which helps investors and stakeholders evaluate financially material sustainability information.
Water Conservation and Smart Irrigation Focus
Water stewardship is a core pillar of BrightView's environmental strategy, especially given the rising prevalence of drought and water scarcity across the United States. The company works with clients to minimize water usage while maintaining landscape health.
A central focus is the promotion and installation of smart irrigation technologies. The global smart irrigation market, which BrightView is a part of, is projected to reach $2.16 billion in 2025, reflecting the necessity of these systems. Smart irrigation systems are defintely a must in 2025.
Key water conservation practices deployed include:
- Implementing smart irrigation systems, including weather-responsive controls and soil moisture sensors, to apply water only when and where needed.
- Encouraging drought-tolerant planting (xeriscaping) and the use of native plant species to reduce dependency on water-intensive turf.
- Using drip irrigation for ornamental shrubs and trees, which significantly reduces water loss from evaporation and runoff.
- Employing best practices like setting mower blades higher and applying mulch to increase soil water retention.
Here's a quick look at the core environmental metrics and goals for BrightView as of the 2025 fiscal year:
| Metric Category | Key 2025 Data Point or Goal | Strategic Relevance |
|---|---|---|
| Carbon Neutrality Target | Achieve carbon neutrality by 2035 | Long-term climate commitment and competitive differentiator. |
| Scope 1 & 2 Emissions (FY22 Baseline) | 153,500 MT CO₂e | Benchmark for measuring decarbonization progress. |
| Electrified Fleet Goal | 90% of the management fleet to be hybrid/electric by 2030 | Directly addresses primary source of operational emissions. |
| Snow Revenue Volatility (9-mo FY25) | Snow removal revenue decreased $10.5 million (4.7%) | Shows financial risk exposure to climate-driven weather variability. |
| Water Conservation Strategy | Central focus on smart irrigation and drought-resistant planting | Mitigates regulatory and physical risk from water scarcity. |
Disclaimer
All information, articles, and product details provided on this website are for general informational and educational purposes only. We do not claim any ownership over, nor do we intend to infringe upon, any trademarks, copyrights, logos, brand names, or other intellectual property mentioned or depicted on this site. Such intellectual property remains the property of its respective owners, and any references here are made solely for identification or informational purposes, without implying any affiliation, endorsement, or partnership.
We make no representations or warranties, express or implied, regarding the accuracy, completeness, or suitability of any content or products presented. Nothing on this website should be construed as legal, tax, investment, financial, medical, or other professional advice. In addition, no part of this site—including articles or product references—constitutes a solicitation, recommendation, endorsement, advertisement, or offer to buy or sell any securities, franchises, or other financial instruments, particularly in jurisdictions where such activity would be unlawful.
All content is of a general nature and may not address the specific circumstances of any individual or entity. It is not a substitute for professional advice or services. Any actions you take based on the information provided here are strictly at your own risk. You accept full responsibility for any decisions or outcomes arising from your use of this website and agree to release us from any liability in connection with your use of, or reliance upon, the content or products found herein.