
|
Valoración DCF de Casey's General Stores, Inc. (CASY) |
Completamente Editable: Adáptelo A Sus Necesidades En Excel O Sheets
Diseño Profesional: Plantillas Confiables Y Estándares De La Industria
Predeterminadas Para Un Uso Rápido Y Eficiente
Compatible con MAC / PC, completamente desbloqueado
No Se Necesita Experiencia; Fáciles De Seguir
Casey's General Stores, Inc. (CASY) Bundle
¡Descubra el potencial real de Casey's General Stores, Inc. (Casy) con nuestra calculadora DCF avanzada! Ajuste los supuestos clave, explore varios escenarios y evalúe cómo los cambios influyen en la valoración de las tiendas generales de Casey, Inc. (Casy), todo dentro de una plantilla de Excel conveniente.
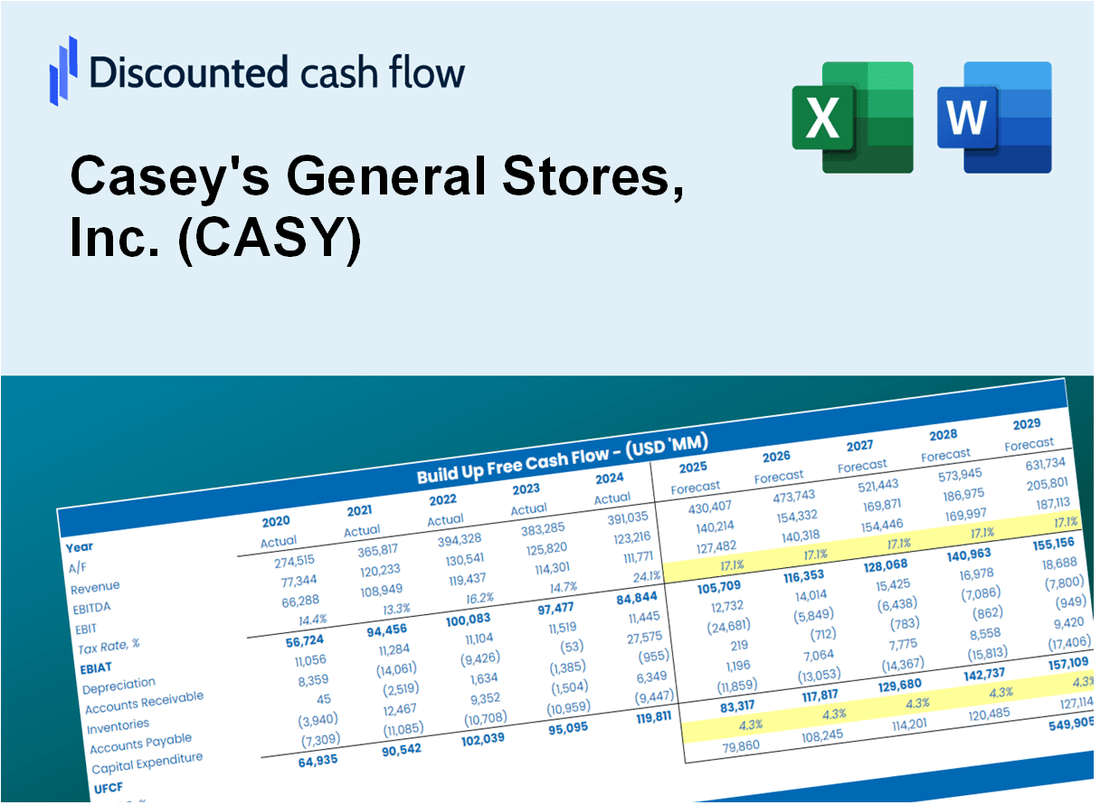
Discounted Cash Flow (DCF) - (USD MM)
| Year | AY1 2021 |
AY2 2022 |
AY3 2023 |
AY4 2024 |
AY5 2025 |
FY1 2026 |
FY2 2027 |
FY3 2028 |
FY4 2029 |
FY5 2030 |
|---|---|---|---|---|---|---|---|---|---|---|
| Revenue | 8,707.2 | 12,952.6 | 15,094.5 | 14,862.9 | 15,940.9 | 18,770.9 | 22,103.3 | 26,027.4 | 30,648.0 | 36,089.0 |
| Revenue Growth, % | 0 | 48.76 | 16.54 | -1.53 | 7.25 | 17.75 | 17.75 | 17.75 | 17.75 | 17.75 |
| EBITDA | 719.2 | 801.2 | 952.5 | 1,059.4 | 1,200.0 | 1,329.4 | 1,565.5 | 1,843.4 | 2,170.6 | 2,556.0 |
| EBITDA, % | 8.26 | 6.19 | 6.31 | 7.13 | 7.53 | 7.08 | 7.08 | 7.08 | 7.08 | 7.08 |
| Depreciation | 265.2 | 303.5 | 313.1 | 349.8 | 403.6 | 463.6 | 545.9 | 642.8 | 757.0 | 891.3 |
| Depreciation, % | 3.05 | 2.34 | 2.07 | 2.35 | 2.53 | 2.47 | 2.47 | 2.47 | 2.47 | 2.47 |
| EBIT | 454.0 | 497.7 | 639.3 | 709.6 | 796.4 | 865.8 | 1,019.5 | 1,200.5 | 1,413.7 | 1,664.6 |
| EBIT, % | 5.21 | 3.84 | 4.24 | 4.77 | 5 | 4.61 | 4.61 | 4.61 | 4.61 | 4.61 |
| Total Cash | 336.5 | 158.9 | 378.9 | 206.5 | 326.7 | 414.5 | 488.0 | 574.7 | 676.7 | 796.9 |
| Total Cash, percent | .0 | .0 | .0 | .0 | .0 | .0 | .0 | .0 | .0 | .0 |
| Account Receivables | 89.3 | 152.1 | 143.9 | 168.9 | 181.5 | 203.8 | 239.9 | 282.5 | 332.7 | 391.8 |
| Account Receivables, % | 1.03 | 1.17 | 0.95329 | 1.14 | 1.14 | 1.09 | 1.09 | 1.09 | 1.09 | 1.09 |
| Inventories | 286.6 | 396.2 | 376.1 | 428.7 | 480.0 | 553.3 | 651.5 | 767.2 | 903.4 | 1,063.7 |
| Inventories, % | 3.29 | 3.06 | 2.49 | 2.88 | 3.01 | 2.95 | 2.95 | 2.95 | 2.95 | 2.95 |
| Accounts Payable | 355.5 | 588.8 | 560.5 | 569.5 | 620.4 | 753.3 | 887.0 | 1,044.5 | 1,230.0 | 1,448.3 |
| Accounts Payable, % | 4.08 | 4.55 | 3.71 | 3.83 | 3.89 | 4.01 | 4.01 | 4.01 | 4.01 | 4.01 |
| Capital Expenditure | -441.3 | -326.5 | -476.6 | -522.0 | -506.2 | -654.5 | -770.7 | -907.5 | -1,068.6 | -1,258.3 |
| Capital Expenditure, % | -5.07 | -2.52 | -3.16 | -3.51 | -3.18 | -3.49 | -3.49 | -3.49 | -3.49 | -3.49 |
| Tax Rate, % | 23.29 | 23.29 | 23.29 | 23.29 | 23.29 | 23.29 | 23.29 | 23.29 | 23.29 | 23.29 |
| EBITAT | 348.8 | 383.7 | 486.1 | 542.9 | 610.9 | 663.5 | 781.3 | 920.0 | 1,083.3 | 1,275.6 |
| Depreciation | ||||||||||
| Changes in Account Receivables | ||||||||||
| Changes in Inventories | ||||||||||
| Changes in Accounts Payable | ||||||||||
| Capital Expenditure | ||||||||||
| UFCF | 152.3 | 421.7 | 322.7 | 302.0 | 495.3 | 510.0 | 555.9 | 654.5 | 770.7 | 907.6 |
| WACC, % | 6.36 | 6.36 | 6.35 | 6.36 | 6.36 | 6.36 | 6.36 | 6.36 | 6.36 | 6.36 |
| PV UFCF | ||||||||||
| SUM PV UFCF | 2,784.3 | |||||||||
| Long Term Growth Rate, % | 2.00 | |||||||||
| Free cash flow (T + 1) | 926 | |||||||||
| Terminal Value | 21,253 | |||||||||
| Present Terminal Value | 15,618 | |||||||||
| Enterprise Value | 18,402 | |||||||||
| Net Debt | 2,631 | |||||||||
| Equity Value | 15,771 | |||||||||
| Diluted Shares Outstanding, MM | 37 | |||||||||
| Equity Value Per Share | 422.32 |
What You Will Get
- Pre-Filled Financial Model: Casey's actual data enables precise DCF valuation for (CASY).
- Full Forecast Control: Customize revenue growth, margins, WACC, and other essential drivers.
- Instant Calculations: Automatic updates provide real-time results as you make adjustments.
- Investor-Ready Template: A polished Excel file crafted for professional-grade valuation.
- Customizable and Reusable: Designed for flexibility, allowing repeated use for comprehensive forecasts.
Key Features
- Real-Life CASY Data: Pre-filled with Casey's General Stores' historical financials and forward-looking projections.
- Fully Customizable Inputs: Adjust revenue growth, margins, WACC, tax rates, and capital expenditures.
- Dynamic Valuation Model: Automatic updates to Net Present Value (NPV) and intrinsic value based on your inputs.
- Scenario Testing: Create multiple forecast scenarios to analyze different valuation outcomes.
- User-Friendly Design: Simple, structured, and designed for professionals and beginners alike.
How It Works
- Download the Template: Gain immediate access to the Excel-based CASY DCF Calculator.
- Input Your Assumptions: Modify the yellow-highlighted cells for growth rates, WACC, margins, and other variables.
- Instant Calculations: The model will automatically refresh to display Casey's intrinsic value.
- Test Scenarios: Experiment with different assumptions to assess potential valuation impacts.
- Analyze and Decide: Utilize the outcomes to inform your investment or financial analysis.
Why Choose Casey's General Stores, Inc. (CASY)?
- Convenient Locations: With numerous stores, access to essentials is just around the corner.
- Quality Products: A wide selection of fresh food and beverages ensures customer satisfaction.
- Community Focused: Committed to supporting local initiatives and fostering community ties.
- Customer-Centric Service: Friendly staff and exceptional service create a welcoming atmosphere.
- Proven Track Record: Trusted by millions for reliable service and quality over the years.
Who Should Use This Product?
- Retail Management Students: Understand inventory management and sales strategies using real-world examples from Casey's General Stores, Inc. (CASY).
- Researchers: Utilize data from Casey's to enhance studies on consumer behavior and retail trends.
- Investors: Evaluate your investment strategies and assess the financial performance of Casey's General Stores, Inc. (CASY).
- Market Analysts: Optimize your analysis with a tailored, ready-to-use financial model specific to Casey's operations.
- Entrepreneurs: Learn from the operational practices of a successful convenience store chain like Casey's General Stores, Inc. (CASY).
What the Template Contains
- Historical Data: Includes Casey's General Stores' past financials and baseline forecasts.
- DCF and Levered DCF Models: Detailed templates to calculate Casey's intrinsic value.
- WACC Sheet: Pre-built calculations for Weighted Average Cost of Capital.
- Editable Inputs: Modify key drivers like growth rates, EBITDA %, and CAPEX assumptions.
- Quarterly and Annual Statements: A complete breakdown of Casey's financials.
- Interactive Dashboard: Visualize valuation results and projections dynamically.
Disclaimer
All information, articles, and product details provided on this website are for general informational and educational purposes only. We do not claim any ownership over, nor do we intend to infringe upon, any trademarks, copyrights, logos, brand names, or other intellectual property mentioned or depicted on this site. Such intellectual property remains the property of its respective owners, and any references here are made solely for identification or informational purposes, without implying any affiliation, endorsement, or partnership.
We make no representations or warranties, express or implied, regarding the accuracy, completeness, or suitability of any content or products presented. Nothing on this website should be construed as legal, tax, investment, financial, medical, or other professional advice. In addition, no part of this site—including articles or product references—constitutes a solicitation, recommendation, endorsement, advertisement, or offer to buy or sell any securities, franchises, or other financial instruments, particularly in jurisdictions where such activity would be unlawful.
All content is of a general nature and may not address the specific circumstances of any individual or entity. It is not a substitute for professional advice or services. Any actions you take based on the information provided here are strictly at your own risk. You accept full responsibility for any decisions or outcomes arising from your use of this website and agree to release us from any liability in connection with your use of, or reliance upon, the content or products found herein.