
|
Valoración DCF de CBAK Energy Technology, Inc. (CBAT) |
Completamente Editable: Adáptelo A Sus Necesidades En Excel O Sheets
Diseño Profesional: Plantillas Confiables Y Estándares De La Industria
Predeterminadas Para Un Uso Rápido Y Eficiente
Compatible con MAC / PC, completamente desbloqueado
No Se Necesita Experiencia; Fáciles De Seguir
CBAK Energy Technology, Inc. (CBAT) Bundle
Ya sea que sea un inversor o un analista, esta calculadora DCF (CBAT) es su herramienta de referencia para una valoración precisa. Precedidos con datos de CBAK Energy Technology, Inc., puede ajustar los pronósticos y observar instantáneamente los efectos.
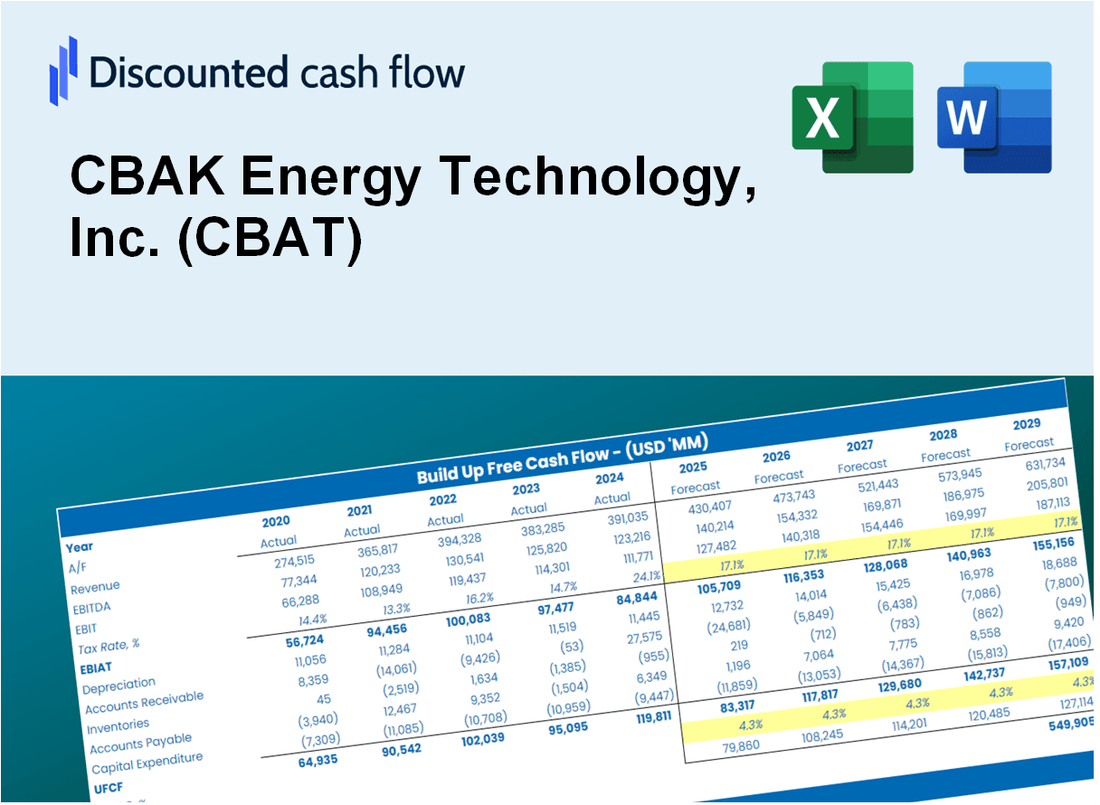
Discounted Cash Flow (DCF) - (USD MM)
| Year | AY1 2020 |
AY2 2021 |
AY3 2022 |
AY4 2023 |
AY5 2024 |
FY1 2025 |
FY2 2026 |
FY3 2027 |
FY4 2028 |
FY5 2029 |
|---|---|---|---|---|---|---|---|---|---|---|
| Revenue | 37.6 | 52.7 | 248.7 | 204.4 | 176.6 | 224.6 | 285.7 | 363.5 | 462.3 | 588.1 |
| Revenue Growth, % | 0 | 40.21 | 372.24 | -17.81 | -13.61 | 27.2 | 27.2 | 27.2 | 27.2 | 27.2 |
| EBITDA | -3.1 | -8.4 | 3.4 | 10.2 | 20.6 | -2.7 | -3.5 | -4.4 | -5.6 | -7.2 |
| EBITDA, % | -8.21 | -15.88 | 1.38 | 4.97 | 11.66 | -1.22 | -1.22 | -1.22 | -1.22 | -1.22 |
| Depreciation | 3.0 | 3.9 | 8.6 | 10.3 | 11.3 | 13.6 | 17.3 | 22.0 | 28.0 | 35.6 |
| Depreciation, % | 7.95 | 7.4 | 3.44 | 5.06 | 6.41 | 6.05 | 6.05 | 6.05 | 6.05 | 6.05 |
| EBIT | -6.1 | -12.3 | -5.1 | -.2 | 9.3 | -16.3 | -20.8 | -26.4 | -33.6 | -42.7 |
| EBIT, % | -16.16 | -23.28 | -2.06 | -0.08881699 | 5.24 | -7.27 | -7.27 | -7.27 | -7.27 | -7.27 |
| Total Cash | 11.9 | 8.1 | 6.5 | 4.8 | 11.0 | 26.2 | 33.3 | 42.4 | 53.9 | 68.6 |
| Total Cash, percent | .0 | .0 | .0 | .0 | .0 | .0 | .0 | .0 | .0 | .0 |
| Account Receivables | 35.5 | 60.1 | 32.9 | 34.0 | 44.9 | 112.3 | 142.8 | 181.6 | 231.0 | 293.9 |
| Account Receivables, % | 94.54 | 114.06 | 13.24 | 16.62 | 25.45 | 49.97 | 49.97 | 49.97 | 49.97 | 49.97 |
| Inventories | 5.3 | 30.1 | 49.4 | 33.4 | 22.9 | 54.1 | 68.8 | 87.5 | 111.3 | 141.6 |
| Inventories, % | 13.98 | 57.21 | 19.88 | 16.34 | 12.94 | 24.07 | 24.07 | 24.07 | 24.07 | 24.07 |
| Accounts Payable | 19.6 | 40.4 | 32.5 | 82.8 | 26.3 | 88.6 | 112.7 | 143.3 | 182.3 | 231.9 |
| Accounts Payable, % | 52.07 | 76.61 | 13.07 | 40.52 | 14.9 | 39.44 | 39.44 | 39.44 | 39.44 | 39.44 |
| Capital Expenditure | -5.7 | -19.2 | -12.4 | -31.1 | -17.2 | -36.7 | -46.6 | -59.3 | -75.5 | -96.0 |
| Capital Expenditure, % | -15.2 | -36.48 | -4.97 | -15.23 | -9.73 | -16.32 | -16.32 | -16.32 | -16.32 | -16.32 |
| Tax Rate, % | -5.8 | -5.8 | -5.8 | -5.8 | -5.8 | -5.8 | -5.8 | -5.8 | -5.8 | -5.8 |
| EBITAT | -5.0 | -14.0 | -4.6 | -.1 | 9.8 | -13.5 | -17.2 | -21.8 | -27.8 | -35.3 |
| Depreciation | ||||||||||
| Changes in Account Receivables | ||||||||||
| Changes in Inventories | ||||||||||
| Changes in Accounts Payable | ||||||||||
| Capital Expenditure | ||||||||||
| UFCF | -29.0 | -58.0 | -8.4 | 44.4 | -53.0 | -72.8 | -67.7 | -86.1 | -109.5 | -139.3 |
| WACC, % | 9.63 | 9.8 | 9.7 | 9.21 | 9.8 | 9.63 | 9.63 | 9.63 | 9.63 | 9.63 |
| PV UFCF | ||||||||||
| SUM PV UFCF | -351.8 | |||||||||
| Long Term Growth Rate, % | 2.00 | |||||||||
| Free cash flow (T + 1) | -142 | |||||||||
| Terminal Value | -1,863 | |||||||||
| Present Terminal Value | -1,176 | |||||||||
| Enterprise Value | -1,528 | |||||||||
| Net Debt | 23 | |||||||||
| Equity Value | -1,552 | |||||||||
| Diluted Shares Outstanding, MM | 90 | |||||||||
| Equity Value Per Share | -17.21 |
What You Will Receive
- Authentic CBAK Data: Preloaded financial metrics – from revenue to EBIT – derived from real and forecasted figures.
- Complete Customization: Modify all essential parameters (yellow cells) such as WACC, growth %, and tax rates.
- Instant Valuation Adjustments: Automatic recalculations to assess the effects of changes on CBAK’s fair value.
- Flexible Excel Template: Designed for quick modifications, scenario analysis, and comprehensive projections.
- Efficient and Precise: Eliminate the need to build models from the ground up while ensuring accuracy and adaptability.
Key Features
- Customizable Forecast Inputs: Adjust essential metrics such as revenue growth, EBITDA %, and capital expenditures for CBAK Energy Technology, Inc. (CBAT).
- Instant DCF Valuation: Quickly computes intrinsic value, NPV, and additional financial metrics.
- High-Precision Accuracy: Leverages CBAK’s actual financial data to deliver realistic valuation results.
- Simplified Scenario Analysis: Effortlessly evaluate various assumptions and analyze different outcomes.
- Efficiency Booster: Avoid the hassle of constructing intricate valuation models from the ground up.
How It Works
- 1. Access the Template: Download and open the Excel file containing CBAK Energy Technology, Inc.'s (CBAT) preloaded data.
- 2. Modify Assumptions: Adjust key parameters such as growth rates, WACC, and capital expenditures.
- 3. Instant Results: The DCF model automatically computes the intrinsic value and NPV.
- 4. Explore Scenarios: Evaluate various forecasts to assess different valuation results.
- 5. Present with Assurance: Deliver professional valuation insights to back your strategic decisions.
Why Choose CBAK Energy Technology, Inc. (CBAT)?
- Innovative Solutions: Cutting-edge technology tailored for the energy sector.
- Proven Performance: Consistent results backed by reliable data and analysis.
- Customizable Options: Flexible products that can be adapted to meet specific energy needs.
- User-Friendly Interface: Intuitive design ensures easy navigation and understanding of features.
- Industry Expertise: Developed by professionals with extensive experience in energy technology.
Who Should Use This Product?
- Investors: Evaluate CBAK Energy Technology, Inc.'s (CBAT) market position before making investment decisions.
- CFOs and Financial Analysts: Optimize valuation methodologies and assess financial forecasts for CBAT.
- Startup Founders: Understand the valuation models applied to companies like CBAK Energy Technology, Inc. (CBAT).
- Consultants: Provide detailed valuation analyses and reports for clients interested in CBAT.
- Students and Educators: Utilize real-time data from CBAK Energy Technology, Inc. (CBAT) to learn and teach valuation strategies.
What the Template Contains
- Pre-Filled DCF Model: CBAK Energy Technology's financial data preloaded for immediate use.
- WACC Calculator: Detailed calculations for Weighted Average Cost of Capital.
- Financial Ratios: Evaluate CBAK Energy Technology's profitability, leverage, and efficiency.
- Editable Inputs: Change assumptions such as growth, margins, and CAPEX to fit your scenarios.
- Financial Statements: Annual and quarterly reports to support detailed analysis.
- Interactive Dashboard: Easily visualize key valuation metrics and results.
Disclaimer
All information, articles, and product details provided on this website are for general informational and educational purposes only. We do not claim any ownership over, nor do we intend to infringe upon, any trademarks, copyrights, logos, brand names, or other intellectual property mentioned or depicted on this site. Such intellectual property remains the property of its respective owners, and any references here are made solely for identification or informational purposes, without implying any affiliation, endorsement, or partnership.
We make no representations or warranties, express or implied, regarding the accuracy, completeness, or suitability of any content or products presented. Nothing on this website should be construed as legal, tax, investment, financial, medical, or other professional advice. In addition, no part of this site—including articles or product references—constitutes a solicitation, recommendation, endorsement, advertisement, or offer to buy or sell any securities, franchises, or other financial instruments, particularly in jurisdictions where such activity would be unlawful.
All content is of a general nature and may not address the specific circumstances of any individual or entity. It is not a substitute for professional advice or services. Any actions you take based on the information provided here are strictly at your own risk. You accept full responsibility for any decisions or outcomes arising from your use of this website and agree to release us from any liability in connection with your use of, or reliance upon, the content or products found herein.