
|
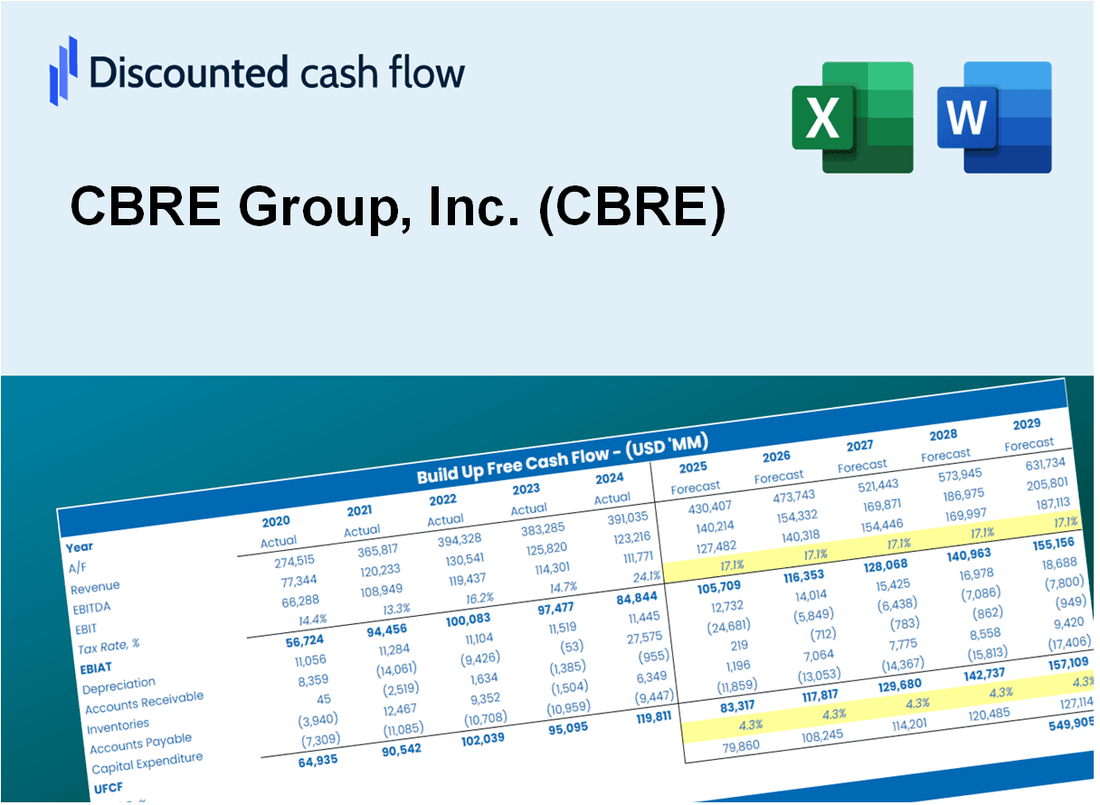
Valoración DCF de CBRE Group, Inc. (CBRE) |
Completamente Editable: Adáptelo A Sus Necesidades En Excel O Sheets
Diseño Profesional: Plantillas Confiables Y Estándares De La Industria
Predeterminadas Para Un Uso Rápido Y Eficiente
Compatible con MAC / PC, completamente desbloqueado
No Se Necesita Experiencia; Fáciles De Seguir
CBRE Group, Inc. (CBRE) Bundle
Engerrado para la precisión, nuestra calculadora CBRE DCF le permite evaluar la valoración del grupo CBRE, Inc. (CBRE) utilizando datos financieros del mundo real, proporcionando una flexibilidad completa para modificar todos los parámetros esenciales para las proyecciones mejoradas.
What You Will Gain
- Comprehensive Financial Model: Leverage CBRE’s actual data for accurate DCF valuation.
- Complete Forecasting Control: Modify revenue growth, profit margins, WACC, and other essential metrics.
- Real-Time Calculations: Automatic updates provide immediate insights as adjustments are made.
- Professional-Grade Template: A polished Excel file crafted for high-quality valuation presentations.
- Flexible and Reusable: Designed for adaptability, enabling extensive use for in-depth forecasting.
Key Features
- Comprehensive Market Data: CBRE’s extensive real estate market analysis and historical performance metrics.
- Customizable Variables: Adjust key inputs such as cap rates, occupancy rates, and revenue projections.
- Real-Time Insights: Monitor CBRE’s valuation metrics update instantly with your adjustments.
- Intuitive Visualizations: Engaging dashboards present valuation outcomes and essential performance indicators.
- Designed for Precision: A robust platform tailored for real estate analysts, investors, and financial professionals.
How It Works
- Step 1: Download the Excel file.
- Step 2: Review pre-entered CBRE data (historical and projected).
- Step 3: Adjust key assumptions (yellow cells) based on your analysis.
- Step 4: View automatic recalculations for CBRE’s intrinsic value.
- Step 5: Use the outputs for investment decisions or reporting.
Why Choose This Calculator for CBRE Group, Inc. (CBRE)?
- User-Friendly Interface: Tailored for both novices and seasoned professionals.
- Customizable Inputs: Adjust parameters easily to suit your financial analysis.
- Real-Time Valuation: Observe immediate updates to CBRE’s valuation as you make changes.
- Preloaded Data: Comes equipped with CBRE’s actual financial metrics for swift evaluations.
- Relied Upon by Experts: Favored by investors and analysts for making strategic decisions.
Who Should Use This Product?
- Real Estate Students: Understand market analysis and apply concepts using real data.
- Academics: Integrate professional real estate models into your curriculum or research projects.
- Investors: Evaluate your investment strategies and analyze property valuation outcomes for CBRE Group, Inc. (CBRE).
- Analysts: Enhance your analysis process with a customizable real estate financial model.
- Property Managers: Learn how large real estate firms like CBRE operate and make informed decisions.
What the Template Contains
- Pre-Filled Data: Includes CBRE Group, Inc.'s (CBRE) historical financials and forecasts.
- Discounted Cash Flow Model: Editable DCF valuation model with automatic calculations.
- Weighted Average Cost of Capital (WACC): A dedicated sheet for calculating WACC based on custom inputs.
- Key Financial Ratios: Analyze CBRE Group, Inc.'s (CBRE) profitability, efficiency, and leverage.
- Customizable Inputs: Edit revenue growth, margins, and tax rates with ease.
- Clear Dashboard: Charts and tables summarizing key valuation results.
Disclaimer
All information, articles, and product details provided on this website are for general informational and educational purposes only. We do not claim any ownership over, nor do we intend to infringe upon, any trademarks, copyrights, logos, brand names, or other intellectual property mentioned or depicted on this site. Such intellectual property remains the property of its respective owners, and any references here are made solely for identification or informational purposes, without implying any affiliation, endorsement, or partnership.
We make no representations or warranties, express or implied, regarding the accuracy, completeness, or suitability of any content or products presented. Nothing on this website should be construed as legal, tax, investment, financial, medical, or other professional advice. In addition, no part of this site—including articles or product references—constitutes a solicitation, recommendation, endorsement, advertisement, or offer to buy or sell any securities, franchises, or other financial instruments, particularly in jurisdictions where such activity would be unlawful.
All content is of a general nature and may not address the specific circumstances of any individual or entity. It is not a substitute for professional advice or services. Any actions you take based on the information provided here are strictly at your own risk. You accept full responsibility for any decisions or outcomes arising from your use of this website and agree to release us from any liability in connection with your use of, or reliance upon, the content or products found herein.