
|
Central Depository Services Limited (CDSL.NS) Valoración de DCF |
Completamente Editable: Adáptelo A Sus Necesidades En Excel O Sheets
Diseño Profesional: Plantillas Confiables Y Estándares De La Industria
Predeterminadas Para Un Uso Rápido Y Eficiente
Compatible con MAC / PC, completamente desbloqueado
No Se Necesita Experiencia; Fáciles De Seguir
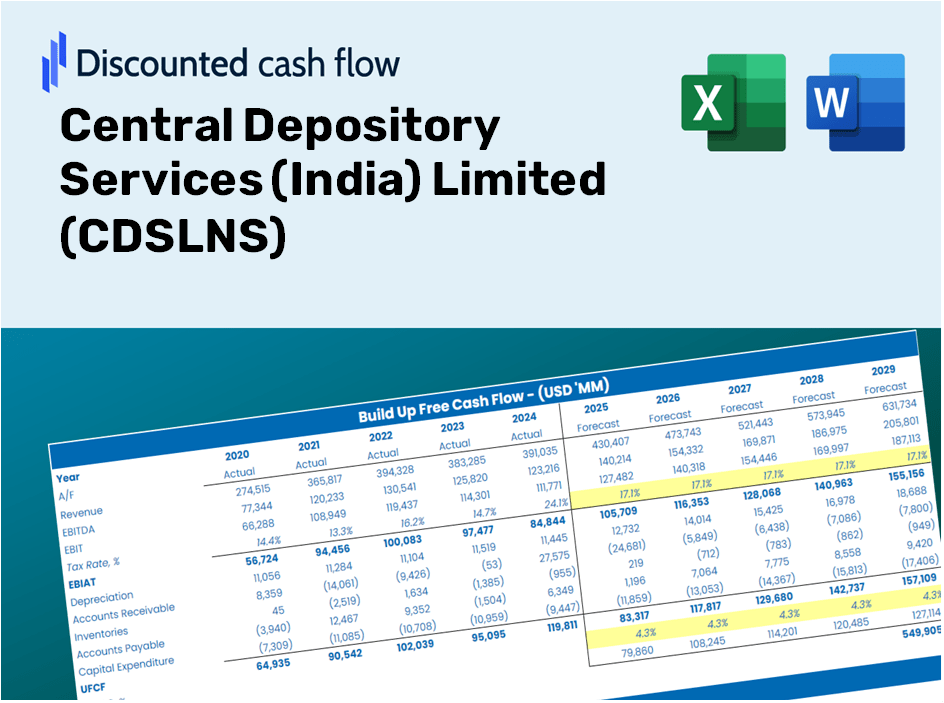
Central Depository Services (India) Limited (CDSL.NS) Bundle
¡Agilice su proceso y mejore la precisión con nuestra calculadora DCF (CDSLNS)! Utilizando datos reales de los Servicios Centrales de Depósito (India) limitados y ajustables, esta herramienta le permite pronosticar, analizar y valor (CDSLN) como un inversor experimentado.
Discounted Cash Flow (DCF) - (USD MM)
| Year | AY1 2021 |
AY2 2022 |
AY3 2023 |
AY4 2024 |
AY5 2025 |
FY1 2026 |
FY2 2027 |
FY3 2028 |
FY4 2029 |
FY5 2030 |
|---|---|---|---|---|---|---|---|---|---|---|
| Revenue | 3,988.1 | 5,977.5 | 6,135.5 | 9,014.4 | 11,920.4 | 15,844.8 | 21,061.1 | 27,994.7 | 37,210.9 | 49,461.2 |
| Revenue Growth, % | 0 | 49.88 | 2.64 | 46.92 | 32.24 | 32.92 | 32.92 | 32.92 | 32.92 | 32.92 |
| EBITDA | 2,702.7 | 4,200.2 | 3,887.9 | 5,833.6 | 7,049.5 | 10,307.2 | 13,700.4 | 18,210.8 | 24,206.0 | 32,175.0 |
| EBITDA, % | 67.77 | 70.27 | 63.37 | 64.71 | 59.14 | 65.05 | 65.05 | 65.05 | 65.05 | 65.05 |
| Depreciation | 92.8 | 114.6 | 194.8 | 272.3 | 126.9 | 364.6 | 484.6 | 644.1 | 856.2 | 1,138.0 |
| Depreciation, % | 2.33 | 1.92 | 3.18 | 3.02 | 1.06 | 2.3 | 2.3 | 2.3 | 2.3 | 2.3 |
| EBIT | 2,609.9 | 4,085.6 | 3,693.1 | 5,561.2 | 6,922.6 | 9,942.6 | 13,215.8 | 17,566.7 | 23,349.9 | 31,037.0 |
| EBIT, % | 65.44 | 68.35 | 60.19 | 61.69 | 58.07 | 62.75 | 62.75 | 62.75 | 62.75 | 62.75 |
| Total Cash | 7,437.7 | 8,420.4 | 5,893.9 | 6,860.5 | 9,560.0 | 14,335.3 | 19,054.7 | 25,327.8 | 33,666.0 | 44,749.3 |
| Total Cash, percent | .0 | .0 | .0 | .0 | .0 | .0 | .0 | .0 | .0 | .0 |
| Account Receivables | 485.2 | 520.8 | 460.7 | 783.6 | 530.2 | 1,316.0 | 1,749.2 | 2,325.1 | 3,090.6 | 4,108.0 |
| Account Receivables, % | 12.17 | 8.71 | 7.51 | 8.69 | 4.45 | 8.31 | 8.31 | 8.31 | 8.31 | 8.31 |
| Inventories | .0 | -6,115.4 | -4,139.5 | 26.5 | .0 | -5,297.7 | -7,041.7 | -9,359.9 | -12,441.4 | -16,537.2 |
| Inventories, % | 0 | -102.31 | -67.47 | 0.2943 | 0 | -33.43 | -33.43 | -33.43 | -33.43 | -33.43 |
| Accounts Payable | 127.0 | 105.9 | 196.2 | 280.4 | 368.6 | 454.9 | 604.7 | 803.7 | 1,068.4 | 1,420.1 |
| Accounts Payable, % | 3.18 | 1.77 | 3.2 | 3.11 | 3.09 | 2.87 | 2.87 | 2.87 | 2.87 | 2.87 |
| Capital Expenditure | -180.8 | -252.4 | -2,085.6 | -734.6 | -1,557.5 | -2,027.0 | -2,694.3 | -3,581.2 | -4,760.2 | -6,327.4 |
| Capital Expenditure, % | -4.53 | -4.22 | -33.99 | -8.15 | -13.07 | -12.79 | -12.79 | -12.79 | -12.79 | -12.79 |
| Tax Rate, % | 24.16 | 24.16 | 24.16 | 24.16 | 24.16 | 24.16 | 24.16 | 24.16 | 24.16 | 24.16 |
| EBITAT | 2,014.7 | 3,111.9 | 2,790.8 | 4,191.9 | 5,250.1 | 7,559.3 | 10,047.9 | 13,355.9 | 17,752.8 | 23,597.2 |
| Depreciation | ||||||||||
| Changes in Account Receivables | ||||||||||
| Changes in Inventories | ||||||||||
| Changes in Accounts Payable | ||||||||||
| Capital Expenditure | ||||||||||
| UFCF | 1,568.5 | 9,032.8 | -925.6 | -675.0 | 4,187.6 | 10,495.1 | 9,298.8 | 12,360.2 | 16,429.3 | 21,838.0 |
| WACC, % | 4.68 | 4.68 | 4.68 | 4.68 | 4.68 | 4.68 | 4.68 | 4.68 | 4.68 | 4.68 |
| PV UFCF | ||||||||||
| SUM PV UFCF | 60,338.3 | |||||||||
| Long Term Growth Rate, % | 2.00 | |||||||||
| Free cash flow (T + 1) | 22,275 | |||||||||
| Terminal Value | 830,311 | |||||||||
| Present Terminal Value | 660,489 | |||||||||
| Enterprise Value | 720,828 | |||||||||
| Net Debt | -1,712 | |||||||||
| Equity Value | 722,540 | |||||||||
| Diluted Shares Outstanding, MM | 209 | |||||||||
| Equity Value Per Share | 3,459.45 |
What You Will Receive
- Comprehensive CDSL Financials: Access to both historical and projected data for precise valuation.
- Customizable Inputs: Adjust parameters like WACC, tax rates, revenue growth, and capital expenditures.
- Real-Time Calculations: Dynamic computation of intrinsic value and NPV.
- Scenario Planning: Analyze various scenarios to assess CDSL's future performance.
- Simple and User-Friendly Interface: Designed for professionals, yet easy for newcomers to navigate.
Key Features
- Accurate Historical Data: Gain access to reliable pre-loaded past performance metrics and future forecasts for Central Depository Services (India) Limited (CDSLNS).
- Customizable Assumptions: Easily modify highlighted parameters such as WACC, growth rates, and profit margins to suit your needs.
- Automated Calculations: Enjoy real-time updates on DCF, Net Present Value (NPV), and cash flow analyses.
- User-Friendly Dashboard: Intuitive charts and summaries that make it simple to interpret your valuation outcomes.
- Designed for All Levels: An accessible and straightforward framework tailored for investors, CFOs, and consultants alike.
How It Works
- Step 1: Download the Excel file.
- Step 2: Examine the pre-filled CDSLNS (Central Depository Services (India) Limited) data, including historical figures and future projections.
- Step 3: Modify key assumptions (highlighted in yellow) based on your analysis and insights.
- Step 4: Observe automatic recalculations that reflect the intrinsic value of CDSLNS (Central Depository Services (India) Limited).
- Step 5: Utilize the generated outputs for your investment strategies or reporting purposes.
Why Opt for CDSLNS?
- Time Efficient: Skip the hassle of building complex models from the ground up – our tools are immediately available.
- Enhanced Accuracy: Dependable financial insights and formulas minimize valuation discrepancies.
- Completely Customizable: Modify the model to align with your specific assumptions and forecasts.
- User-Friendly: Intuitive charts and outputs simplify the analysis of results.
- Endorsed by Professionals: Tailored for experts who prioritize precision and ease of use.
Who Can Benefit from CDSLNS?
- Institutional Investors: Develop precise and comprehensive valuation models for evaluating investments.
- Corporate Finance Departments: Examine valuation scenarios to inform strategic decision-making.
- Advisors and Consultants: Offer clients reliable valuation insights for CDSLNS (CDSL).
- Students and Educators: Utilize real-time data to enhance learning and practice in financial modeling.
- Market Enthusiasts: Gain insights into how companies like CDSLNS (CDSL) are valued within the financial marketplace.
What the CDSLNS Template Contains
- Preloaded CDSLNS Data: Historical and projected financial data, including revenue, EBIT, and capital expenditures.
- DCF and WACC Models: Professional-grade sheets for calculating intrinsic value and Weighted Average Cost of Capital.
- Editable Inputs: Yellow-highlighted cells for adjusting revenue growth, tax rates, and discount rates.
- Financial Statements: Comprehensive annual and quarterly financials for deeper analysis.
- Key Ratios: Profitability, leverage, and efficiency ratios to evaluate performance.
- Dashboard and Charts: Visual summaries of valuation outcomes and assumptions.
Disclaimer
All information, articles, and product details provided on this website are for general informational and educational purposes only. We do not claim any ownership over, nor do we intend to infringe upon, any trademarks, copyrights, logos, brand names, or other intellectual property mentioned or depicted on this site. Such intellectual property remains the property of its respective owners, and any references here are made solely for identification or informational purposes, without implying any affiliation, endorsement, or partnership.
We make no representations or warranties, express or implied, regarding the accuracy, completeness, or suitability of any content or products presented. Nothing on this website should be construed as legal, tax, investment, financial, medical, or other professional advice. In addition, no part of this site—including articles or product references—constitutes a solicitation, recommendation, endorsement, advertisement, or offer to buy or sell any securities, franchises, or other financial instruments, particularly in jurisdictions where such activity would be unlawful.
All content is of a general nature and may not address the specific circumstances of any individual or entity. It is not a substitute for professional advice or services. Any actions you take based on the information provided here are strictly at your own risk. You accept full responsibility for any decisions or outcomes arising from your use of this website and agree to release us from any liability in connection with your use of, or reliance upon, the content or products found herein.