
|
Certara, Inc. (CERT) Valoración DCF |
Completamente Editable: Adáptelo A Sus Necesidades En Excel O Sheets
Diseño Profesional: Plantillas Confiables Y Estándares De La Industria
Predeterminadas Para Un Uso Rápido Y Eficiente
Compatible con MAC / PC, completamente desbloqueado
No Se Necesita Experiencia; Fáciles De Seguir
Certara, Inc. (CERT) Bundle
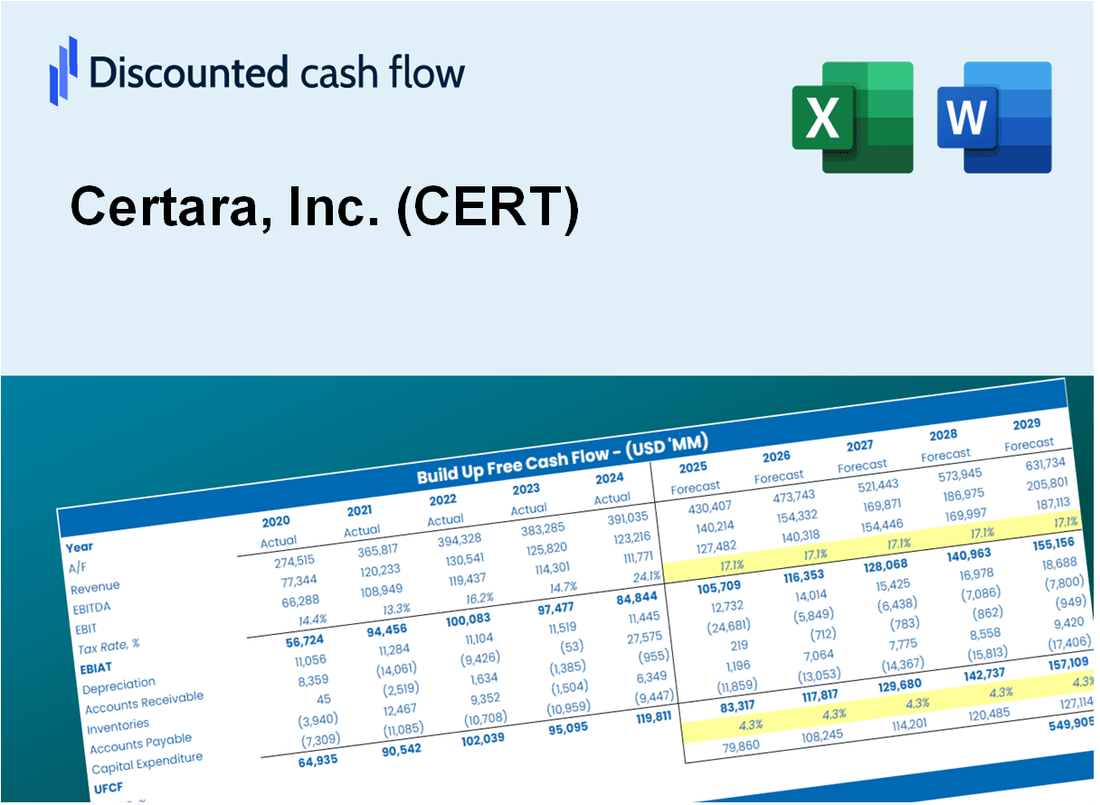
¡Simplifique la valoración de Certara, Inc. (CERT) con esta calculadora DCF personalizable! Con el Real Certara, Inc. (CERT) Financials y las entradas de pronóstico ajustables, puede probar escenarios y revelar el valor razonable de Certara, Inc. (CERT) en solo minutos.
Discounted Cash Flow (DCF) - (USD MM)
| Year | AY1 2020 |
AY2 2021 |
AY3 2022 |
AY4 2023 |
AY5 2024 |
FY1 2025 |
FY2 2026 |
FY3 2027 |
FY4 2028 |
FY5 2029 |
|---|---|---|---|---|---|---|---|---|---|---|
| Revenue | 243.5 | 286.1 | 335.6 | 354.3 | 385.1 | 432.4 | 485.4 | 545.0 | 611.8 | 686.8 |
| Revenue Growth, % | 0 | 17.48 | 17.32 | 5.57 | 8.7 | 12.27 | 12.27 | 12.27 | 12.27 | 12.27 |
| EBITDA | 17.9 | 58.6 | 89.0 | 23.8 | 72.4 | 69.0 | 77.5 | 87.0 | 97.7 | 109.7 |
| EBITDA, % | 7.34 | 20.47 | 26.52 | 6.73 | 18.79 | 15.97 | 15.97 | 15.97 | 15.97 | 15.97 |
| Depreciation | 42.8 | 45.1 | 52.5 | 56.1 | 68.0 | 71.3 | 80.0 | 89.9 | 100.9 | 113.3 |
| Depreciation, % | 17.56 | 15.77 | 15.63 | 15.82 | 17.66 | 16.49 | 16.49 | 16.49 | 16.49 | 16.49 |
| EBIT | -24.9 | 13.5 | 36.5 | -32.2 | 4.3 | -2.2 | -2.5 | -2.8 | -3.2 | -3.6 |
| EBIT, % | -10.22 | 4.71 | 10.88 | -9.1 | 1.13 | -0.51989 | -0.51989 | -0.51989 | -0.51989 | -0.51989 |
| Total Cash | 271.4 | 185.8 | 236.6 | 235.0 | 179.2 | 301.2 | 338.1 | 379.6 | 426.1 | 478.4 |
| Total Cash, percent | .0 | .0 | .0 | .0 | .0 | .0 | .0 | .0 | .0 | .0 |
| Account Receivables | 64.8 | 78.3 | 88.8 | 93.3 | 119.1 | 119.1 | 133.7 | 150.1 | 168.5 | 189.1 |
| Account Receivables, % | 26.61 | 27.37 | 26.46 | 26.32 | 30.92 | 27.53 | 27.53 | 27.53 | 27.53 | 27.53 |
| Inventories | .0 | .0 | .0 | .0 | .0 | .0 | .0 | .0 | .0 | .0 |
| Inventories, % | 0 | 0 | 0 | 0 | 0 | 0 | 0 | 0 | 0 | 0 |
| Accounts Payable | 6.4 | 7.5 | 7.5 | 5.2 | 3.5 | 8.5 | 9.6 | 10.7 | 12.0 | 13.5 |
| Accounts Payable, % | 2.63 | 2.61 | 2.24 | 1.46 | 0.90926 | 1.97 | 1.97 | 1.97 | 1.97 | 1.97 |
| Capital Expenditure | -7.9 | -8.9 | -1.4 | -1.8 | -1.6 | -6.7 | -7.5 | -8.4 | -9.4 | -10.6 |
| Capital Expenditure, % | -3.26 | -3.11 | -0.42605 | -0.5015 | -0.42192 | -1.54 | -1.54 | -1.54 | -1.54 | -1.54 |
| Tax Rate, % | 29.87 | 29.87 | 29.87 | 29.87 | 29.87 | 29.87 | 29.87 | 29.87 | 29.87 | 29.87 |
| EBITAT | -24.5 | 52.9 | 28.7 | -32.4 | 3.0 | -2.0 | -2.3 | -2.5 | -2.8 | -3.2 |
| Depreciation | ||||||||||
| Changes in Account Receivables | ||||||||||
| Changes in Inventories | ||||||||||
| Changes in Accounts Payable | ||||||||||
| Capital Expenditure | ||||||||||
| UFCF | -48.1 | 76.7 | 69.3 | 15.1 | 42.0 | 67.6 | 56.7 | 63.7 | 71.5 | 80.3 |
| WACC, % | 9.85 | 9.87 | 9.59 | 9.87 | 9.48 | 9.73 | 9.73 | 9.73 | 9.73 | 9.73 |
| PV UFCF | ||||||||||
| SUM PV UFCF | 256.7 | |||||||||
| Long Term Growth Rate, % | 4.00 | |||||||||
| Free cash flow (T + 1) | 83 | |||||||||
| Terminal Value | 1,456 | |||||||||
| Present Terminal Value | 915 | |||||||||
| Enterprise Value | 1,172 | |||||||||
| Net Debt | 133 | |||||||||
| Equity Value | 1,039 | |||||||||
| Diluted Shares Outstanding, MM | 160 | |||||||||
| Equity Value Per Share | 6.48 |
What You Will Get
- Real CERT Financials: Access to both historical and projected data for precise valuation.
- Customizable Inputs: Adjust WACC, tax rates, revenue growth, and capital expenditure assumptions.
- Dynamic Calculations: Intrinsic value and NPV are computed in real-time.
- Scenario Analysis: Explore various scenarios to assess Certara’s potential future performance.
- User-Friendly Interface: Designed for professionals while remaining approachable for newcomers.
Key Features
- 🔍 Real-Life CERT Financials: Pre-filled historical and projected data for Certara, Inc. (CERT).
- ✏️ Fully Customizable Inputs: Adjust all critical parameters (yellow cells) such as WACC, growth %, and tax rates.
- 📊 Professional DCF Valuation: Built-in formulas calculate Certara’s intrinsic value using the Discounted Cash Flow method.
- ⚡ Instant Results: Visualize Certara’s valuation instantly after making changes.
- Scenario Analysis: Test and compare outcomes for various financial assumptions side-by-side.
How It Works
- Step 1: Download the Excel file.
- Step 2: Review pre-entered Certara data (historical and projected).
- Step 3: Adjust key assumptions (yellow cells) based on your analysis.
- Step 4: View automatic recalculations for Certara’s intrinsic value.
- Step 5: Use the outputs for investment decisions or reporting.
Why Choose This Calculator for Certara, Inc. (CERT)?
- User-Friendly Interface: Tailored for both novices and seasoned professionals.
- Customizable Parameters: Adjust inputs easily to suit your financial analysis.
- Real-Time Insights: Observe immediate updates to Certara’s valuation as you modify inputs.
- Pre-Configured Data: Comes with Certara’s actual financial metrics for swift evaluations.
- Relied Upon by Experts: Utilized by investors and analysts for making strategic decisions.
Who Should Use This Product?
- Pharmaceutical Researchers: Gain insights into drug development processes and market potential for Certara, Inc. (CERT).
- Healthcare Analysts: Enhance your analyses with comprehensive data and modeling tools specific to the biopharmaceutical industry.
- Consultants: Provide clients with expert evaluations on drug efficacy and market strategies efficiently.
- Biotech Entrepreneurs: Learn from Certara, Inc. (CERT) to inform your own business strategies in the competitive biotech landscape.
- Students in Life Sciences: Understand pharmacokinetics and drug development through real-world applications and case studies.
What the Template Contains
- Pre-Filled Data: Contains Certara’s historical financials and projections.
- Discounted Cash Flow Model: An editable DCF valuation model featuring automatic calculations.
- Weighted Average Cost of Capital (WACC): A dedicated sheet for calculating WACC using customized inputs.
- Key Financial Ratios: Evaluate Certara’s profitability, efficiency, and leverage metrics.
- Customizable Inputs: Easily adjust revenue growth, profit margins, and tax rates.
- Clear Dashboard: Visual representations and tables summarizing essential valuation outcomes.
Disclaimer
All information, articles, and product details provided on this website are for general informational and educational purposes only. We do not claim any ownership over, nor do we intend to infringe upon, any trademarks, copyrights, logos, brand names, or other intellectual property mentioned or depicted on this site. Such intellectual property remains the property of its respective owners, and any references here are made solely for identification or informational purposes, without implying any affiliation, endorsement, or partnership.
We make no representations or warranties, express or implied, regarding the accuracy, completeness, or suitability of any content or products presented. Nothing on this website should be construed as legal, tax, investment, financial, medical, or other professional advice. In addition, no part of this site—including articles or product references—constitutes a solicitation, recommendation, endorsement, advertisement, or offer to buy or sell any securities, franchises, or other financial instruments, particularly in jurisdictions where such activity would be unlawful.
All content is of a general nature and may not address the specific circumstances of any individual or entity. It is not a substitute for professional advice or services. Any actions you take based on the information provided here are strictly at your own risk. You accept full responsibility for any decisions or outcomes arising from your use of this website and agree to release us from any liability in connection with your use of, or reliance upon, the content or products found herein.