
|
Valoración DCF de CrossFirst Bankshares, Inc. (CFB) |
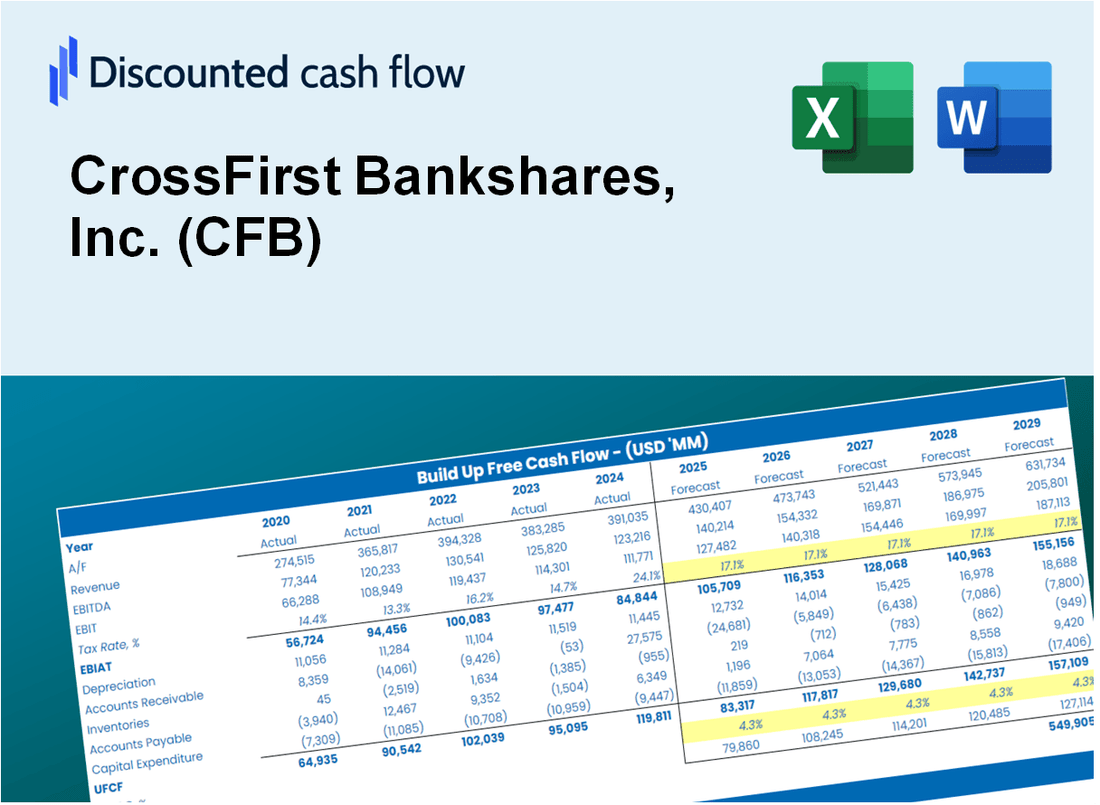
Completamente Editable: Adáptelo A Sus Necesidades En Excel O Sheets
Diseño Profesional: Plantillas Confiables Y Estándares De La Industria
Predeterminadas Para Un Uso Rápido Y Eficiente
Compatible con MAC / PC, completamente desbloqueado
No Se Necesita Experiencia; Fáciles De Seguir
CrossFirst Bankshares, Inc. (CFB) Bundle
¡Obtenga dominio sobre su CrossFirst Bankshares, Inc. (CFB) Análisis de valoración con nuestra calculadora DCF de vanguardia! Prelabastado con datos reales (CFB), esta plantilla de Excel le permite ajustar preventos y supuestos para determinar con precisión el valor intrínseco de CrossFirst Bankshares, Inc. (CFB).
Discounted Cash Flow (DCF) - (USD MM)
| Year | AY1 2019 |
AY2 2020 |
AY3 2021 |
AY4 2022 |
AY5 2023 |
FY1 2024 |
FY2 2025 |
FY3 2026 |
FY4 2027 |
FY5 2028 |
|---|---|---|---|---|---|---|---|---|---|---|
| Revenue | 150.6 | 172.0 | 182.4 | .1 | 231.0 | 242.7 | 255.0 | 268.0 | 281.6 | 295.8 |
| Revenue Growth, % | 0 | 14.21 | 6.03 | -99.96 | 299920.78 | 5.07 | 5.07 | 5.07 | 5.07 | 5.07 |
| EBITDA | 37.9 | 20.6 | 92.2 | 82.9 | 93.6 | 110.8 | 116.4 | 122.3 | 128.5 | 135.0 |
| EBITDA, % | 25.19 | 11.96 | 50.58 | 107632.47 | 40.5 | 45.65 | 45.65 | 45.65 | 45.65 | 45.65 |
| Depreciation | 1.7 | 5.3 | 5.3 | 5.3 | 9.5 | 54.0 | 56.7 | 59.6 | 62.6 | 65.8 |
| Depreciation, % | 1.15 | 3.05 | 2.88 | 6889.61 | 4.1 | 22.24 | 22.24 | 22.24 | 22.24 | 22.24 |
| EBIT | 36.2 | 15.3 | 87.0 | 77.6 | 84.1 | 105.4 | 110.7 | 116.3 | 122.2 | 128.4 |
| EBIT, % | 24.04 | 8.9 | 47.69 | 100742.86 | 36.41 | 43.41 | 43.41 | 43.41 | 43.41 | 43.41 |
| Total Cash | 929.0 | 1,063.4 | 1,228.7 | 301.2 | 234.0 | 242.7 | 255.0 | 268.0 | 281.6 | 295.8 |
| Total Cash, percent | .0 | .0 | .0 | .4 | .0 | .0 | .0 | .0 | .0 | .0 |
| Account Receivables | 15.7 | 17.2 | .0 | .0 | .0 | 9.9 | 10.4 | 11.0 | 11.5 | 12.1 |
| Account Receivables, % | 10.44 | 10.02 | 0 | 0 | 0 | 4.09 | 4.09 | 4.09 | 4.09 | 4.09 |
| Inventories | -206.7 | -428.4 | -499.9 | -330.8 | .0 | -194.2 | -204.0 | -214.4 | -225.2 | -236.7 |
| Inventories, % | -137.24 | -249.09 | -274.14 | -429577.92 | 0 | -80 | -80 | -80 | -80 | -80 |
| Accounts Payable | 31.2 | 43.8 | 32.7 | 87.6 | 94.4 | 99.5 | 104.6 | 109.9 | 115.4 | 121.3 |
| Accounts Payable, % | 20.75 | 25.45 | 17.92 | 113780.52 | 40.87 | 41 | 41 | 41 | 41 | 41 |
| Capital Expenditure | -.9 | -6.1 | -1.2 | -2.6 | -9.0 | -52.7 | -55.4 | -58.2 | -61.2 | -64.3 |
| Capital Expenditure, % | -0.56447 | -3.54 | -0.6641 | -3336.36 | -3.88 | -21.73 | -21.73 | -21.73 | -21.73 | -21.73 |
| Tax Rate, % | 20.73 | 20.73 | 20.73 | 20.73 | 20.73 | 20.73 | 20.73 | 20.73 | 20.73 | 20.73 |
| EBITAT | 30.2 | 12.6 | 69.4 | 61.6 | 66.7 | 85.2 | 89.5 | 94.0 | 98.8 | 103.8 |
| Depreciation | ||||||||||
| Changes in Account Receivables | ||||||||||
| Changes in Inventories | ||||||||||
| Changes in Accounts Payable | ||||||||||
| Capital Expenditure | ||||||||||
| UFCF | 253.3 | 244.5 | 151.1 | -49.9 | -256.8 | 275.8 | 105.2 | 110.5 | 116.1 | 122.0 |
| WACC, % | 28.24 | 27.97 | 27.37 | 27.27 | 27.24 | 27.62 | 27.62 | 27.62 | 27.62 | 27.62 |
| PV UFCF | ||||||||||
| SUM PV UFCF | 413.6 | |||||||||
| Long Term Growth Rate, % | 2.00 | |||||||||
| Free cash flow (T + 1) | 124 | |||||||||
| Terminal Value | 486 | |||||||||
| Present Terminal Value | 144 | |||||||||
| Enterprise Value | 557 | |||||||||
| Net Debt | -147 | |||||||||
| Equity Value | 704 | |||||||||
| Diluted Shares Outstanding, MM | 49 | |||||||||
| Equity Value Per Share | 14.28 |
What You Will Receive
- Pre-Filled Financial Model: CrossFirst Bankshares, Inc.'s (CFB) actual data facilitates accurate DCF valuation.
- Comprehensive Forecast Control: Modify revenue growth, margins, WACC, and other essential drivers.
- Instantaneous Calculations: Automatic updates guarantee you see results in real-time as adjustments are made.
- Professional-Grade Template: A polished Excel file crafted for expert-level valuation.
- Customizable and Reusable: Designed for adaptability, enabling repeated use for in-depth forecasts.
Key Features
- 🔍 Real-Life CFB Financials: Pre-filled historical and projected data for CrossFirst Bankshares, Inc. (CFB).
- ✏️ Fully Customizable Inputs: Adjust all critical parameters (yellow cells) like WACC, growth %, and tax rates.
- 📊 Professional DCF Valuation: Built-in formulas calculate CrossFirst's intrinsic value using the Discounted Cash Flow method.
- ⚡ Instant Results: Visualize CrossFirst's valuation instantly after making changes.
- Scenario Analysis: Test and compare outcomes for various financial assumptions side-by-side.
How It Works
- Step 1: Download the Excel file.
- Step 2: Review CrossFirst Bankshares, Inc.'s (CFB) pre-filled financial data and forecasts.
- Step 3: Modify key inputs such as loan growth, cost of capital, and tax rates (highlighted cells).
- Step 4: Observe the DCF model update in real-time as you adjust your assumptions.
- Step 5: Evaluate the outputs and leverage the results for your investment strategies.
Why Choose This Calculator for CrossFirst Bankshares, Inc. (CFB)?
- Accuracy: Utilizes real CrossFirst Bankshares financial data for precise calculations.
- Flexibility: Allows users to easily adjust and experiment with various inputs.
- Time-Saving: Avoid the complexities of constructing a DCF model from the ground up.
- Professional-Grade: Crafted with the expertise and detail expected at the CFO level.
- User-Friendly: Intuitive interface designed for users of all financial expertise levels.
Who Should Use CrossFirst Bankshares, Inc. (CFB)?
- Institutional Investors: Develop comprehensive financial models for assessing investment opportunities in CFB.
- Banking Analysts: Evaluate performance metrics and market trends to inform strategic decisions.
- Financial Advisors: Offer clients informed insights on the valuation and potential of CrossFirst Bankshares, Inc. (CFB).
- Students and Academics: Utilize real-time financial data to enhance learning in banking and finance courses.
- Market Researchers: Analyze the banking sector to understand the positioning and valuation of CFB in the industry.
What the Template Contains
- Historical Data: Includes CrossFirst Bankshares, Inc.'s (CFB) past financials and baseline forecasts.
- DCF and Levered DCF Models: Detailed templates to calculate CrossFirst Bankshares, Inc.'s (CFB) intrinsic value.
- WACC Sheet: Pre-built calculations for Weighted Average Cost of Capital.
- Editable Inputs: Modify key drivers like growth rates, EBITDA %, and CAPEX assumptions.
- Quarterly and Annual Statements: A complete breakdown of CrossFirst Bankshares, Inc.'s (CFB) financials.
- Interactive Dashboard: Visualize valuation results and projections dynamically.
Disclaimer
All information, articles, and product details provided on this website are for general informational and educational purposes only. We do not claim any ownership over, nor do we intend to infringe upon, any trademarks, copyrights, logos, brand names, or other intellectual property mentioned or depicted on this site. Such intellectual property remains the property of its respective owners, and any references here are made solely for identification or informational purposes, without implying any affiliation, endorsement, or partnership.
We make no representations or warranties, express or implied, regarding the accuracy, completeness, or suitability of any content or products presented. Nothing on this website should be construed as legal, tax, investment, financial, medical, or other professional advice. In addition, no part of this site—including articles or product references—constitutes a solicitation, recommendation, endorsement, advertisement, or offer to buy or sell any securities, franchises, or other financial instruments, particularly in jurisdictions where such activity would be unlawful.
All content is of a general nature and may not address the specific circumstances of any individual or entity. It is not a substitute for professional advice or services. Any actions you take based on the information provided here are strictly at your own risk. You accept full responsibility for any decisions or outcomes arising from your use of this website and agree to release us from any liability in connection with your use of, or reliance upon, the content or products found herein.