
|
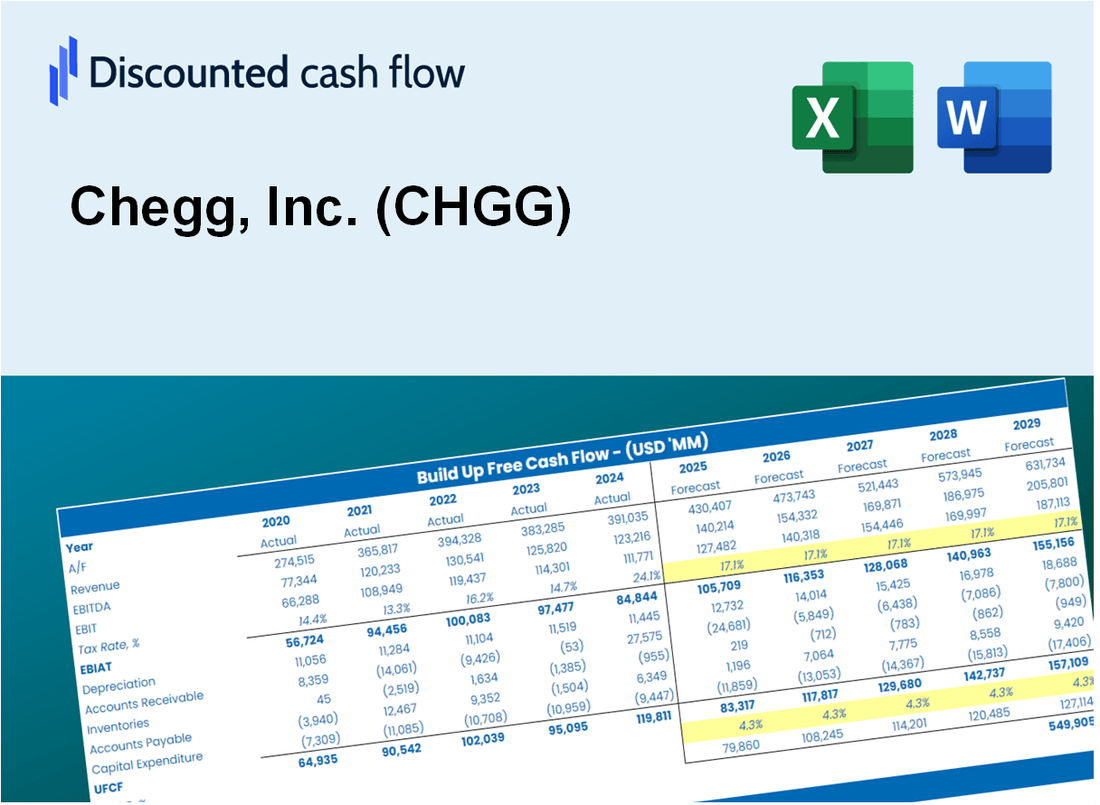
Valoración DCF de Chegg, Inc. (CHGG) |
Completamente Editable: Adáptelo A Sus Necesidades En Excel O Sheets
Diseño Profesional: Plantillas Confiables Y Estándares De La Industria
Predeterminadas Para Un Uso Rápido Y Eficiente
Compatible con MAC / PC, completamente desbloqueado
No Se Necesita Experiencia; Fáciles De Seguir
Chegg, Inc. (CHGG) Bundle
Independientemente de si es un inversor o analista, esta calculadora DCF (CHGG) sirve como su recurso esencial para una valoración precisa. Con datos reales de Chegg, Inc. ya incluidos, puede ajustar los pronósticos e inmediatamente observar los efectos.
What You Will Get
- Editable Excel Template: A fully customizable Excel-based DCF Calculator featuring pre-filled real Chegg, Inc. (CHGG) financials.
- Real-World Data: Historical data and forward-looking estimates (as indicated in the highlighted cells).
- Forecast Flexibility: Adjust forecast assumptions such as revenue growth, EBITDA %, and WACC.
- Automatic Calculations: Instantly observe how your inputs affect Chegg, Inc. (CHGG)'s valuation.
- Professional Tool: Designed for investors, CFOs, consultants, and financial analysts.
- User-Friendly Design: Organized for clarity and ease of use, complete with step-by-step instructions.
Key Features
- Real-Time CHGG Data: Pre-filled with Chegg’s historical financials and future growth projections.
- Fully Customizable Inputs: Adjust parameters such as revenue growth, margins, WACC, tax rates, and capital expenditures.
- Dynamic Valuation Model: Automatic updates to Net Present Value (NPV) and intrinsic value based on your adjustments.
- Scenario Testing: Develop multiple forecasting scenarios to evaluate various valuation possibilities.
- User-Friendly Design: Intuitive, organized, and suitable for both professionals and newcomers.
How It Works
- 1. Access the Template: Download and open the Excel file featuring Chegg, Inc.'s (CHGG) preloaded data.
- 2. Modify Assumptions: Adjust key inputs such as growth rates, WACC, and capital expenditures specific to Chegg, Inc. (CHGG).
- 3. Analyze Results Immediately: The DCF model automatically computes intrinsic value and NPV for Chegg, Inc. (CHGG).
- 4. Explore Scenarios: Evaluate various forecasts to understand different valuation possibilities for Chegg, Inc. (CHGG).
- 5. Present with Assurance: Share professional valuation insights for Chegg, Inc. (CHGG) to reinforce your decisions.
Why Choose This Calculator for Chegg, Inc. (CHGG)?
- All-in-One Solution: Features DCF, WACC, and financial ratio analyses tailored for Chegg, Inc. (CHGG).
- Flexible Inputs: Modify yellow-highlighted cells to explore different financial scenarios.
- In-Depth Analysis: Automatically computes Chegg’s intrinsic value and Net Present Value.
- Data-Rich Environment: Historical and projected data provide reliable starting points for your calculations.
- Expert-Level Tool: Perfect for financial analysts, investors, and business consultants focusing on Chegg, Inc. (CHGG).
Who Should Use This Product?
- Investors: Accurately assess Chegg, Inc.’s (CHGG) fair value to inform investment choices.
- CFOs: Utilize a comprehensive DCF model for financial reporting and strategic analysis.
- Consultants: Easily customize the template for client valuation reports.
- Entrepreneurs: Discover financial modeling techniques employed by leading companies.
- Educators: Implement it as a resource for teaching valuation practices.
What the Chegg Template Contains
- Comprehensive DCF Model: Editable template featuring detailed valuation calculations.
- Real-World Data: Chegg, Inc.'s historical and projected financials preloaded for analysis.
- Customizable Parameters: Adjust WACC, growth rates, and tax assumptions to explore various scenarios.
- Financial Statements: Complete annual and quarterly breakdowns for in-depth insights.
- Key Ratios: Integrated analysis for profitability, efficiency, and leverage metrics.
- Dashboard with Visual Outputs: Charts and tables designed for clear, actionable results.
Disclaimer
All information, articles, and product details provided on this website are for general informational and educational purposes only. We do not claim any ownership over, nor do we intend to infringe upon, any trademarks, copyrights, logos, brand names, or other intellectual property mentioned or depicted on this site. Such intellectual property remains the property of its respective owners, and any references here are made solely for identification or informational purposes, without implying any affiliation, endorsement, or partnership.
We make no representations or warranties, express or implied, regarding the accuracy, completeness, or suitability of any content or products presented. Nothing on this website should be construed as legal, tax, investment, financial, medical, or other professional advice. In addition, no part of this site—including articles or product references—constitutes a solicitation, recommendation, endorsement, advertisement, or offer to buy or sell any securities, franchises, or other financial instruments, particularly in jurisdictions where such activity would be unlawful.
All content is of a general nature and may not address the specific circumstances of any individual or entity. It is not a substitute for professional advice or services. Any actions you take based on the information provided here are strictly at your own risk. You accept full responsibility for any decisions or outcomes arising from your use of this website and agree to release us from any liability in connection with your use of, or reliance upon, the content or products found herein.