
|
Análisis de 5 Fuerzas de CorVel Corporation (CRVL) [Actualizado en enero de 2025] |
Completamente Editable: Adáptelo A Sus Necesidades En Excel O Sheets
Diseño Profesional: Plantillas Confiables Y Estándares De La Industria
Predeterminadas Para Un Uso Rápido Y Eficiente
Compatible con MAC / PC, completamente desbloqueado
No Se Necesita Experiencia; Fáciles De Seguir
CorVel Corporation (CRVL) Bundle
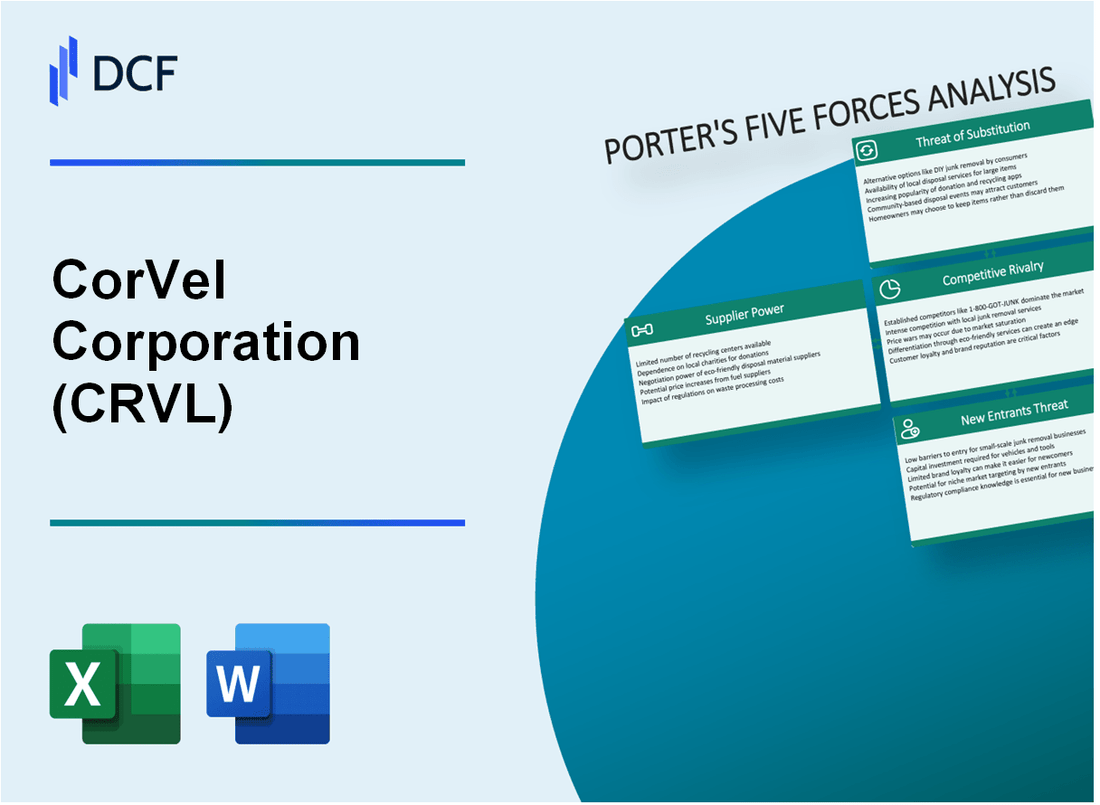
En el panorama dinámico de la tecnología de la salud y los servicios de atención administrada, Corvel Corporation navega por un complejo ecosistema de fuerzas competitivas que dan forma a su posicionamiento estratégico. Al diseccionar el marco de las cinco fuerzas de Michael Porter, presentamos la intrincada dinámica del poder de los proveedores, las negociaciones de los clientes, la rivalidad del mercado, los posibles sustitutos y las barreras de entrada que definen la estrategia competitiva de Corvel en 2024. Este análisis de profundidad revela cómo la compañía mantiene su ventaja en un mercado de servicios de salud desafiantes y en rápida evolución.
Corvel Corporation (CRVL) - Las cinco fuerzas de Porter: poder de negociación de los proveedores
Número limitado de proveedores especializados de tecnología de salud
A partir de 2024, Corvel Corporation enfrenta un mercado de proveedores concentrado con aproximadamente 7-10 proveedores clave de tecnología de salud especializadas. La relación de concentración del mercado de tecnología de salud se estima en 65-70%.
| Categoría de proveedor | Número de proveedores principales | Porcentaje de participación de mercado |
|---|---|---|
| Soluciones de software empresarial | 3-4 | 42% |
| Infraestructura de TI de atención médica | 4-5 | 28% |
| Tecnología de atención administrada | 2-3 | 30% |
Altos costos de cambio para la tecnología central
Los costos de cambio de soluciones empresariales centrales son significativos, que van desde $ 1.2 millones a $ 3.5 millones por ciclo de implementación.
- Costo promedio de migración de software: $ 2.4 millones
- Gastos de integración estimados: $ 750,000 - $ 1.1 millones
- Pérdida potencial de productividad durante la transición: 15-22%
Dependencia de los proveedores de tecnología clave
Corvel Corporation se basa en 3 proveedores de tecnología primaria para soluciones empresariales críticas, con el 68% de la infraestructura central dependiente de estos proveedores.
| Proveedor | Segmento tecnológico | Porcentaje de dependencia |
|---|---|---|
| Major proveedor de nubes A | Infraestructura en la nube | 35% |
| Proveedor de software empresarial B | Sistemas de gestión | 22% |
| Soluciones de TI de atención médica c | Tecnología de atención médica especializada | 11% |
Potencial de integración vertical
Los proveedores de tecnología demuestran un potencial de integración vertical creciente, con el 42% de los principales proveedores que exploran las ofertas de servicios directos en los mercados de tecnología de salud.
- Inversión estimada de I + D por los principales proveedores: $ 180-250 millones anualmente
- Tasa de intento de integración vertical: 37%
- Riesgo potencial de interrupción del mercado: alto
Corvel Corporation (CRVL) - Las cinco fuerzas de Porter: poder de negociación de los clientes
Concentración de grandes seguros de atención médica y mercados de compensación de trabajadores
A partir de 2024, los 5 principales proveedores de seguros de salud controlan el 44.8%de la participación de mercado total, incluida UnitedHealth Group (14.3%), Anthem (12.2%), Humana (8.7%), Cigna (8.3%) y Centeno (7.3% ).
| Segmento de mercado | Concentración de mercado | Impacto en Corvel |
|---|---|---|
| Seguro de salud | 44.8% por los 5 principales proveedores | Alta potencia del comprador |
| Compensación de trabajadores | Las 3 mejores aseguradoras controlan 35.6% | Palancamiento de negociación moderado |
Sensibilidad de los precios en la atención administrada y los servicios de contención de costos médicos
El valor promedio del contrato de Corvel para los servicios de contención de costos médicos oscila entre $ 250,000 y $ 1.5 millones anuales, con una sensibilidad de precio con un promedio de 12-15% entre los clientes empresariales.
- Elasticidad promedio del precio: 14.2%
- Expectativas de reducción de costos: 10-18% por contrato
- Frecuencia de licitación competitiva: trimestral a semestralmente
Contratos a largo plazo con clientes empresariales
Corvel mantiene el 67% de los contratos de clientes empresariales con duraciones entre 3 y 5 años, reduciendo la volatilidad del cliente y proporcionando flujos de ingresos estables.
| Duración del contrato | Porcentaje de clientes | Impacto anual de ingresos |
|---|---|---|
| 1-2 años | 22% | $ 45-60 millones |
| 3-5 años | 67% | $ 135-180 millones |
| 5+ años | 11% | $ 22-30 millones |
Capacidad para personalizar soluciones
Corvel ofrece personalización en el 82% de los contratos empresariales, con el 63% de los clientes que reciben soluciones de contención de costos médicos personalizados.
- Tasa de personalización: 82%
- Clientes de solución a medida: 63%
- Complejidad de personalización promedio: medio a alto
Corvel Corporation (CRVL) - Las cinco fuerzas de Porter: rivalidad competitiva
Estructura de mercado y panorama competitivo
A partir de 2024, Corvel opera en un mercado de servicios de salud fragmentados con múltiples competidores. El panorama competitivo de la compañía incluye:
| Competidor | Segmento de mercado | Ingresos anuales |
|---|---|---|
| Servicios GenEx | Compensación de trabajadores | $ 385.6 millones |
| Mitchell International | Gestión de costos médicos | $ 512.3 millones |
| Sedgwick | Gestión de riesgos | $ 1.2 mil millones |
Análisis de intensidad competitiva
La dinámica competitiva clave para Corvel incluye:
- Ratio de concentración del mercado: 45% entre los 5 mejores competidores
- Márgenes promedio de ganancias de la industria: 12.7%
- Tasa de inversión tecnológica: 6.3% de los ingresos anuales
Inversiones de tecnología e innovación
Gasto tecnológico de Corvel en 2023:
| Categoría de tecnología | Monto de la inversión |
|---|---|
| AI y aprendizaje automático | $ 22.4 millones |
| Infraestructura en la nube | $ 15.6 millones |
| Ciberseguridad | $ 8.2 millones |
Métricas de participación de mercado
- Cuota de mercado de Corvel: 8.5%
- Mercado total direccionable: $ 4.2 mil millones
- Crecimiento de la participación de mercado año tras año: 3.2%
Corvel Corporation (CRVL) - Las cinco fuerzas de Porter: amenaza de sustitutos
Plataformas emergentes de telesalud y gestión de salud digital
El tamaño del mercado de TeleHealth alcanzó los $ 79.79 mil millones en 2020 y se proyecta que crecerá a $ 396.76 mil millones para 2027, con una tasa compuesta anual de 25.8%.
| Plataforma | Penetración del mercado | Tasa de crecimiento anual |
|---|---|---|
| Salud de teladoc | Cuota de mercado del 42.5% | 22.3% |
| Amwell | Cuota de mercado del 18,7% | 17.6% |
| Mdlive | Cuota de mercado de 12.3% | 15.9% |
Soluciones de gestión de riesgos internas
Las grandes compañías de seguros invirtieron $ 4.2 mil millones en tecnologías de gestión de riesgos patentadas en 2022.
- Inversión de plataforma interna del Grupo UnitedHealth: $ 1.3 mil millones
- Anthem Presupuesto de gestión de riesgos digitales: $ 892 millones
- Gasto de transformación de tecnología de Cigna: $ 675 millones
AI avanzadas y tecnologías de aprendizaje automático
Se espera que el mercado de IA Healthcare alcance los $ 45.2 mil millones para 2026, con una tasa de crecimiento anual del 44.9%.
| Tecnología de IA | Reducción de costos potenciales | Mejora de la eficiencia |
|---|---|---|
| Análisis predictivo | 23% de reducción de costos operativos | 37% de procesamiento más rápido |
| Procesamiento de reclamos de aprendizaje automático | 18% de reducción de costos administrativos | Mejora de precisión del 42% |
Software de gestión de salud basado en la nube
Global Cloud Computing in Healthcare Market proyectado para alcanzar los $ 89.4 mil millones para 2027.
- Ingresos del segmento de atención médica de AWS: $ 10.2 mil millones en 2022
- Microsoft Azure Healthcare Cloud Services: $ 7.6 mil millones
- Cuota de mercado de Google Cloud Healthcare API: 15.3%
Corvel Corporation (CRVL) - Las cinco fuerzas de Porter: amenaza de nuevos participantes
Altos requisitos de capital inicial para la infraestructura de tecnología de salud
La infraestructura de tecnología de salud de Corvel Corporation requiere una inversión de capital significativa. A partir de 2023, la compañía reportó $ 318.6 millones en activos totales, con inversiones de infraestructura tecnológica estimadas en $ 42.7 millones.
| Componente de infraestructura | Costo de inversión estimado |
|---|---|
| Sistemas de gestión médica empresarial | $ 18.5 millones |
| Infraestructura de seguridad de red | $ 12.3 millones |
| Plataformas de computación en la nube | $ 11.9 millones |
Entorno regulatorio complejo
El sector de la tecnología de la salud requiere amplias inversiones de cumplimiento.
- Costos de cumplimiento de HIPAA: $ 75,000 - $ 250,000 anualmente
- Gastos de documentación regulatoria: $ 45,000 por año
- Salarios del personal de cumplimiento: $ 320,000 - $ 520,000 anualmente
Reputación establecida y relaciones con los clientes
Corvel Corporation mantiene 95% de tasa de retención del cliente con más de 3,500 clientes corporativos en los mercados de atención médica y compensación de trabajadores.
| Categoría de cliente | Número de clientes |
|---|---|
| Fortune 500 Companies | 265 |
| Empresas de tamaño mediano | 1,875 |
| Pequeñas empresas | 1,360 |
Tecnología e inversiones en redes médicas
Corvel invirtió $ 24.6 millones en desarrollo de tecnología patentada en 2023.
- Gasto de I + D: $ 24.6 millones
- Portafolio de patentes: 37 Patentes de tecnología de salud activa
- Conexiones de la red médica: más de 250,000 proveedores de atención médica
CorVel Corporation (CRVL) - Porter's Five Forces: Competitive rivalry
You're looking at a market where CorVel Corporation operates against giants. The competitive rivalry force is significant because CorVel competes directly with significantly larger rivals, including major Third-Party Administrators (TPAs), Managed Care Organizations (MCOs), and national insurance carriers. These larger entities often possess deeper pockets for capital expenditure and broader market reach, which directly pressures CorVel's market share.
The industry itself is mature and fragmented. This means there are many established players vying for the same claims and risk management contracts. Think of established names like Crawford & Co and MedRisk; they, along with others, create a dense competitive field. This fragmentation means that winning business often comes down to granular service differences rather than broad market shifts.
Still, CorVel Corporation posted strong financial results in this tough environment. For the fiscal year ending March 31, 2025, CorVel reported total revenues of $896 million, a clear increase from the $795 million recorded in fiscal year 2024. This growth shows they are successfully navigating the competitive landscape. For instance, the first quarter of fiscal year 2026 (ended June 30, 2025) saw revenues hit $235 million, followed by $240 million for the quarter ended September 30, 2025. That's solid execution.
Rivalry is definitely intensifying due to technology. Companies across the sector are rushing to adopt Generative AI to boost efficiency and cut costs. CorVel is part of this race, having integrated its initial Generative AI module back in 2023 and continuing development, which puts pressure on competitors to match this technological pace or risk being seen as behind the curve. The need to automate objective tasks is now a baseline expectation.
Differentiation is where CorVel pushes back against the scale of its rivals. The company relies heavily on its proprietary platforms and integrated service models to stand out. Key differentiators include their CareMC Edge platform, which enables real-time data input and access for all stakeholders, and the integration of advanced analytics and AI across their service lines. This focus on technology-enabled integration is a direct countermeasure to the rivalry.
Here's a quick look at CorVel's recent financial performance to contextualize its position in this competitive space:
| Metric | FY2025 Amount (Ended 3/31/2025) | FY2024 Amount (Ended 3/31/2024) |
|---|---|---|
| Total Revenue | $896 million | $795 million |
| Gross Profit | $210 million | $172 million |
| Cash & Equivalents (End of Period) | $171 million | $105.6 million (End of FY2024) |
The push for technological superiority means that investment in R&D and platform enhancement is non-negotiable for survival. CorVel's strategy centers on using technology to drive better outcomes, which translates into competitive advantage. The capabilities they emphasize include:
- Integration of people and data for faster decision-making.
- Embedded standards and algorithms to guide adjuster actions.
- Visibility and reporting for greater claim transparency.
- Generative AI to summarize complex medical documents.
To be fair, maintaining this level of differentiation requires continuous, heavy investment. If onboarding takes 14+ days, churn risk rises because competitors are promising faster digital integration. Finance: draft 13-week cash view by Friday to ensure sufficient liquidity for ongoing AI platform development.
CorVel Corporation (CRVL) - Porter's Five Forces: Threat of substitutes
You're looking at CorVel Corporation (CRVL) as of late 2025, and the threat of substitutes is definitely real. When we look at the company's fiscal year revenue ending March 31, 2025, which hit $896 million, we need to see what external forces could chip away at that top line. Substitutes aren't just other companies offering the same service; they are entirely different ways for employers and payers to manage risk and claims.
Self-administered employer programs, or in-house claims management, serve as a primary substitute for CorVel Corporation's outsourced services. The shift here is significant: according to the KFF 2025 report, 63% of covered workers in the US are now enrolled in self-funded health plans. This means a growing base of employers is taking direct control over claims management, which is a direct substitute for the Third Party Administration (TPA) and case management services CorVel Corporation provides. We're seeing a trend where 12 million additional employees are expected to leave fully insured health plans by 2030, suggesting this substitution pressure will only intensify. The Property & Casualty industry, for context, wrote $43 billion in workers' comp premiums in 2023, showing the scale of the market where self-insurance is an option.
Value-based care (VBC) models are another major substitute, especially for CorVel Corporation's fee-based bill review services. VBC shifts payment away from volume (fee-for-service) toward outcomes, quality, and cost efficiency. The Value Based Care Payment market size grew from $2.79 billion in 2024 to $3.17 billion in 2025, showing a 13.8% compound annual growth rate (CAGR) in that historic period. To put that in perspective for large players, UnitedHealth predicted that $75 billion of its payments to medical care providers will be attached to VBC relationships. More than 6 in 10 survey respondents expect higher VBC revenue in 2025 than in 2024, indicating a strong industry pivot that de-emphasizes pure fee negotiation.
Standalone technology platforms offering point solutions can replace specific modules within CorVel Corporation's integrated offering. This is where pure-play AI bill review or specialized automation tools come in. The broader AI in insurance market is projected to hit $7.6 billion in 2025. For claims processing specifically, AI-driven systems are already processing 31% of all claims volume in 2025. If a payer only needs a best-in-class AI bill review engine, a standalone vendor can substitute that single function, even if CorVel Corporation has invested in its own AI, as noted by their Q4 2025 report mentioning investment in AI to enhance billing practices.
Telehealth and virtual care platforms present a substitution threat to traditional, in-person case management. While CorVel Corporation offers these, the broader market growth shows how readily care delivery can shift away from traditional models. The global telehealth market, valued at $79.79 billion in 2020, is projected to reach $396.76 billion by 2027, growing at a 25.8% CAGR. This massive growth indicates that virtual care is becoming the default for many interactions, substituting the need for traditional, high-touch, in-person case management.
The defintely growing trend of other companies adopting AI for claims automation is a major, cross-cutting threat. This isn't just about point solutions; it's about the entire claims ecosystem becoming automated. We see that 84% of insurers have adopted or are actively deploying AI-driven solutions in 2025. This widespread adoption means competitors-and even self-administering employers-are rapidly closing the efficiency gap. Here's the quick math: AI automation has led to a 33% cut in administrative costs across major U.S. insurers this year, and claims processing times dropped by 59% in 2025 for firms using AI. What this estimate hides is the speed at which these tools are becoming commoditized, lowering the barrier to entry for smaller, specialized substitutes.
Here is a snapshot of the market dynamics that represent these substitution pressures:
| Substitute Category | Market Metric | Value / Rate (Latest Available Data) |
|---|---|---|
| Self-Administered Programs | US Workers in Self-Funded Plans (2025) | 63% |
| Value-Based Care | VBC Payment Market Size (2025) | $3.17 billion |
| Value-Based Care | VBC Payment Market CAGR (2024-2025 Historic) | 13.8% |
| AI Bill Review/Tech Platforms | AI in Insurance Claims Processing Market Size (2025) | $0.46 billion |
| Telehealth/Virtual Care | Telehealth Market CAGR (2020-2027 Projection) | 25.8% |
The key areas where CorVel Corporation must defend its market share against substitutes include:
- Employer preference for in-house control.
- Shifting payer focus to VBC metrics.
- Adoption of pure-play AI bill review tools.
- Increased reliance on virtual care for case management.
- Competitors achieving significant cost cuts via AI.
Finance: draft 13-week cash view by Friday.
CorVel Corporation (CRVL) - Porter's Five Forces: Threat of new entrants
You're looking at CorVel Corporation (CRVL) and wondering how tough it is for a new player to muscle in on their managed care and claims services. Honestly, the barriers to entry here are substantial, definitely more than just a simple startup cost.
First off, the regulatory maze is a huge hurdle. Operating in all 50 US states means navigating a patchwork of specific licensing and compliance requirements for workers' compensation and health claims administration. That administrative overhead alone can stop a small operation dead in its tracks before it even signs its first carrier contract.
Building out the infrastructure is another beast. A national provider network doesn't just appear; it takes years of contracting and relationship management. Plus, competing with proprietary technology like CareMC requires serious, sustained capital investment. New entrants need deep pockets just to reach parity on the tech front, let alone leapfrog it.
Here's the quick math on why CorVel Corporation's own financial structure acts as a moat against debt-reliant competition. Their balance sheet strength means they can weather market fluctuations or invest aggressively without the immediate pressure of interest payments that a leveraged startup would face. What this estimate hides is the sheer scale of operational capital required to service claims reliably.
Consider these recent figures showing their debt-free position:
| Metric | Date/Period | Amount (USD) |
|---|---|---|
| Cash and Cash Equivalents | Q3 FY2026 (Sept 30, 2025) | $207 million |
| Total Borrowings | Q3 FY2026 (Sept 30, 2025) | $0 |
| Fiscal Year 2025 Revenue | Year Ended March 31, 2025 | $896 million |
| Fiscal Year 2025 Diluted EPS (Adjusted) | Year Ended March 31, 2025 | $1.83 |
That debt-free status is a real advantage when you're talking to a large carrier looking for stability. They've built trust over time, and new entrants have to spend years proving they won't fold when a major claim cycle hits.
Still, you can't ignore the disruptors. Technology-focused startups, especially those leveraging AI, could potentially bypass some of those traditional network and regulatory barriers with a low-cost, highly automated model. CorVel Corporation is definitely aware of this, evidenced by their own focus on integrating agentic AI and generative AI capabilities to improve claim precision and efficiency, like with their CERIS service.
The threat isn't zero, but it's channeled. New entrants face:
- Navigating 50 state regulatory frameworks.
- Matching established provider network scale.
- Overcoming incumbent trust with large carriers.
- Funding massive proprietary technology builds.
- Competing against CorVel Corporation's $207 million cash position.
Finance: review the capital expenditure required for a greenfield AI claims platform versus CorVel Corporation's current R&D spend by next Tuesday.
Disclaimer
All information, articles, and product details provided on this website are for general informational and educational purposes only. We do not claim any ownership over, nor do we intend to infringe upon, any trademarks, copyrights, logos, brand names, or other intellectual property mentioned or depicted on this site. Such intellectual property remains the property of its respective owners, and any references here are made solely for identification or informational purposes, without implying any affiliation, endorsement, or partnership.
We make no representations or warranties, express or implied, regarding the accuracy, completeness, or suitability of any content or products presented. Nothing on this website should be construed as legal, tax, investment, financial, medical, or other professional advice. In addition, no part of this site—including articles or product references—constitutes a solicitation, recommendation, endorsement, advertisement, or offer to buy or sell any securities, franchises, or other financial instruments, particularly in jurisdictions where such activity would be unlawful.
All content is of a general nature and may not address the specific circumstances of any individual or entity. It is not a substitute for professional advice or services. Any actions you take based on the information provided here are strictly at your own risk. You accept full responsibility for any decisions or outcomes arising from your use of this website and agree to release us from any liability in connection with your use of, or reliance upon, the content or products found herein.