
|
Covenant Logistics Group, Inc. (CVLG): Análisis de 5 Fuerzas [Actualizado en Ene-2025] |
Completamente Editable: Adáptelo A Sus Necesidades En Excel O Sheets
Diseño Profesional: Plantillas Confiables Y Estándares De La Industria
Predeterminadas Para Un Uso Rápido Y Eficiente
Compatible con MAC / PC, completamente desbloqueado
No Se Necesita Experiencia; Fáciles De Seguir
Covenant Logistics Group, Inc. (CVLG) Bundle
La navegación del complejo panorama de la logística, Covenant Logistics Group, Inc. (CVLG) se encuentra en la intersección de la innovación del transporte y el posicionamiento estratégico del mercado. En una industria caracterizada por desafíos dinámicos y fuerzas competitivas en evolución, comprender la intrincada red de relaciones con proveedores, dinámica del cliente, presiones competitivas, sustitutos potenciales y barreras de entrada se vuelve crucial para descifrar la resiliencia estratégica de la empresa. Este análisis del marco Five Forces de Michael Porter revela el ecosistema matizado en el que opera CVLG, ofreciendo información sobre la estrategia competitiva de la compañía y las trayectorias de crecimiento potencial en el sector de transporte y logística en constante cambio.
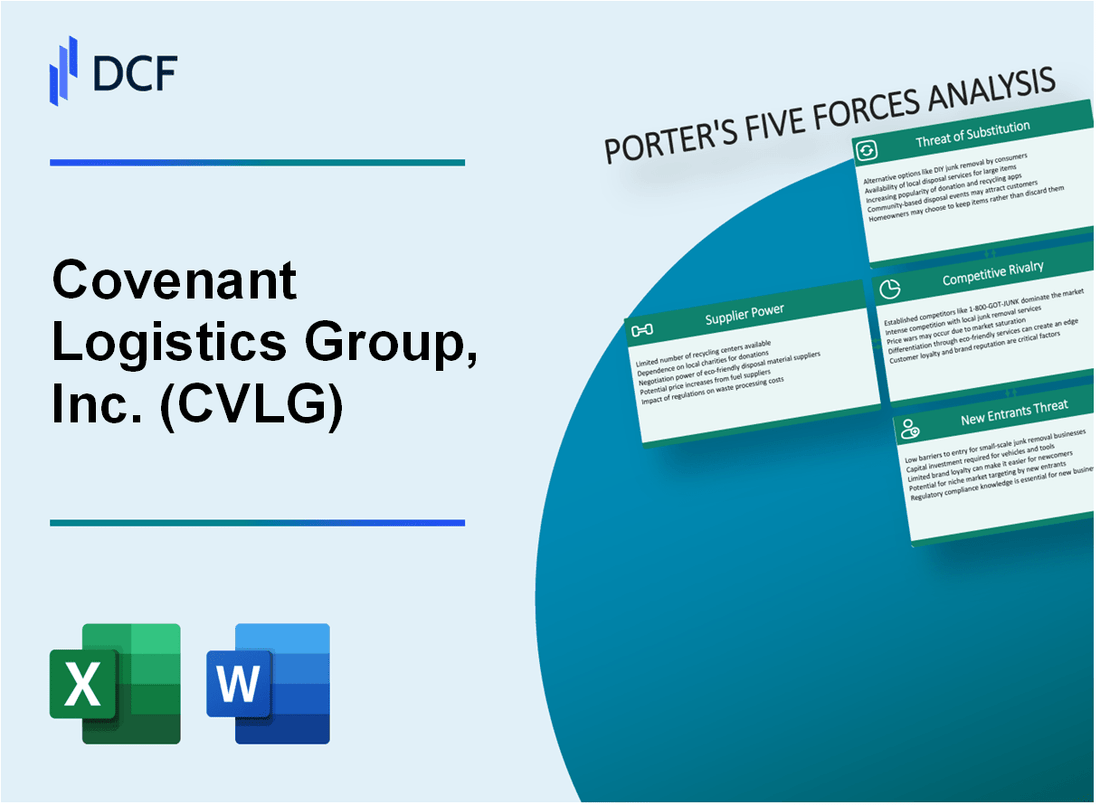
Covenant Logistics Group, Inc. (CVLG) - Las cinco fuerzas de Porter: poder de negociación de los proveedores
Número limitado de fabricantes de equipos de camiones especializados
A partir de 2024, el mercado de fabricación de equipos de camiones demuestra una concentración significativa:
| Fabricante | Cuota de mercado | Producción de camiones pesados |
|---|---|---|
| Vendedor | 40.2% | 153,600 unidades |
| Kenworth | 22.7% | 86,700 unidades |
| Peterbilt | 18.5% | 70,500 unidades |
Influencia de los proveedores de combustible
Dinámica de precios de combustible para el grupo de logística del pacto:
- Precio diesel promedio: $ 4.15 por galón
- Gasto anual de combustible: $ 42.3 millones
- Rango de volatilidad del costo del combustible: 12-18% por año
Dependencia de proveedores específicos de tecnología de remolques y camiones
| Proveedor de tecnología | Tipo de tecnología | Valor anual del contrato |
|---|---|---|
| Wabash National | Fabricación de remolques | $ 8.7 millones |
| Rey termo | Sistemas de refrigeración | $ 3.2 millones |
Potencial de asociación estratégica
Relaciones actuales de proveedores de equipos estratégicos:
- Grupo Volvo: Acuerdo de suministro a largo plazo
- Cummins Inc.: Asociación de tecnología de motores
- Dana Incorporated: contrato de componentes de transmisión
Covenant Logistics Group, Inc. (CVLG) - Las cinco fuerzas de Porter: poder de negociación de los clientes
Diversa base de clientes
A partir del cuarto trimestre de 2023, Covenant Logistics Group atiende a 1,247 clientes activos en múltiples industrias, incluyendo:
- Automotriz: 32% de la cartera de clientes
- Minorista: 24% de la cartera de clientes
- Fabricación: 18% de la cartera de clientes
- Bienes de consumo: 15% de la cartera de clientes
- Otras industrias: 11% de la cartera de clientes
Precios de servicios de transporte
| Categoría de servicio | Precio promedio por milla | Competitividad del mercado |
|---|---|---|
| Transporte de camiones | $2.14 | 98% competitivo con las tasas de mercado |
| Transporte dedicado | $1.87 | 95% competitivo con las tasas de mercado |
| Logística especializada | $2.45 | 99% competitivo con las tasas de mercado |
Contratos de clientes a largo plazo
En 2023, el Grupo de logística de Covenant mantuvo:
- 87 contratos a largo plazo con los principales clientes de envío
- Duración promedio del contrato: 3.4 años
- Rango de valor del contrato: $ 1.2M - $ 7.5M anual
Soluciones de transporte especializadas
Las capacidades de transporte especializadas incluyen:
- Flete controlado por temperatura: 22% de los servicios de transporte totales
- Transporte de materiales peligrosos: 15% de los servicios totales de transporte
- Protección de carga de alto valor: 12% de los servicios totales de transporte
Análisis de concentración de clientes
| Segmento de cliente superior | Porcentaje de ingresos totales | Contribución anual de ingresos |
|---|---|---|
| Los 5 mejores clientes | 34% | $ 187.6 millones |
| Los 10 mejores clientes | 48% | $ 263.4 millones |
Covenant Logistics Group, Inc. (CVLG) - Las cinco fuerzas de Porter: rivalidad competitiva
Panorama competitivo Overview
A partir de 2024, el sector de Servicios de Logística de Camiones y Sector de Logística cuenta con 613,000 portadores de motor para alquiler en los Estados Unidos, con la logística del pacto que compiten en un mercado fragmentado.
| Segmento de mercado | Número de operadores | Rango de participación de mercado |
|---|---|---|
| Grandes transportistas (más de 100 camiones) | 14,192 | 33.4% |
| Transportistas medianos (20-99 camiones) | 31,568 | 28.6% |
| Pequeños transportistas (menos de 20 camiones) | 567,240 | 38% |
Factores competitivos clave
La logística del pacto enfrenta la competencia de múltiples segmentos con diferentes capacidades:
- Transportistas nacionales de carga de camiones con ingresos superiores a $ 1 mil millones
- Empresas de camiones regionales con ofertas de servicios especializados
- Proveedores de logística impulsados por la tecnología
Análisis de la competencia directa
| Competidor | Ingresos anuales | Tamaño de la flota |
|---|---|---|
| Servicios de transporte de J.B. Hunt | $ 4.87 mil millones | 16,500 camiones |
| Transporte Knight-Swift | $ 6.23 mil millones | 18,700 camiones |
| Werner Enterprises | $ 2.45 mil millones | 7.800 camiones |
Diferenciación de tecnología y servicio
Covenant Logistics invierte $ 12.4 millones anuales en infraestructura tecnológica y modernización de la flota para mantener un posicionamiento competitivo.
- Sistemas telemáticos avanzados
- Capacidades de seguimiento en tiempo real
- Plataformas integradas de gestión de transporte
Métricas de concentración del mercado
El mercado de Servicios de Camionload exhibe un índice Herfindahl-Hirschman (HHI) de 785, lo que indica un entorno moderadamente competitivo.
| Categoría de concentración del mercado | Gama HHI | Intensidad competitiva |
|---|---|---|
| Baja concentración | 0-1,500 | Altamente competitivo |
| Concentración moderada | 1,500-2,500 | Moderadamente competitivo |
| Alta concentración | 2,500+ | Menos competitivo |
Covenant Logistics Group, Inc. (CVLG) - Las cinco fuerzas de Porter: amenaza de sustitutos
Modos de transporte alternativos
En 2023, el desglose del mercado de transporte de carga de EE. UU. Mostró:
| Modo de transporte | Cuota de mercado (%) | Ingresos anuales ($) |
|---|---|---|
| Camionaje | 65.4% | $ 875.5 mil millones |
| Flete de ferrocarril | 22.7% | $ 304.2 mil millones |
| Flete aéreo | 5.9% | $ 79.1 mil millones |
Soluciones de transporte intermodal
Estadísticas del mercado de transporte intermodal para 2023:
- Volumen total de flete intermodal: 14.7 millones de contenedores
- Crecimiento año tras año: 3.2%
- Valor de mercado estimado: $ 46.3 mil millones
Tecnologías de logística emergente
Tasas de adopción de tecnología en logística:
| Tecnología | Tasa de adopción (%) | Ahorro de costos potenciales |
|---|---|---|
| Logística con IA | 27.4% | $ 40.1 mil millones |
| Logística de blockchain | 12.6% | $ 15.7 mil millones |
Plataformas de coincidencia de carga digital
Información del mercado de la plataforma de flete digital:
- Tamaño del mercado de la plataforma de flete digital global: $ 3.2 mil millones
- CAGR proyectada: 25.3% (2023-2028)
- Número de plataformas de flete digitales activas: 87
Covenant Logistics Group, Inc. (CVLG) - Cinco fuerzas de Porter: amenaza de nuevos participantes
Altos requisitos de capital inicial para la adquisición de flota de camiones
A partir de 2024, el costo promedio de un nuevo camión Clase 8 oscila entre $ 150,000 y $ 180,000. Para una flota de 50 camiones, la inversión de capital inicial sería de aproximadamente $ 7.5 millones a $ 9 millones.
| Tamaño de la flota | Rango de costos de camiones | Inversión total |
|---|---|---|
| 50 camiones | $ 150,000 - $ 180,000 por camión | $ 7.5M - $ 9M |
Complejidades regulatorias de cumplimiento y licencia
La obtención de licencias y permisos necesarios implica costos y complejidad significativos:
- Tarifa de registro de la Administración Federal de Seguridad del Motorizador (FMCSA): $ 300
- Registro de operadores unificados (UCR) Tarifa anual: $ 76 - $ 1,525
- Aplicación de número de puntos: $ 300
- Costos de licencia de conducir comercial (CDL) por conductor: $ 50 - $ 200
Requisitos de infraestructura y tecnología logística
| Tecnología | Costo estimado |
|---|---|
| Sistema de gestión de transporte | $ 5,000 - $ 50,000 anualmente |
| Sistema de seguimiento del GPS | $ 20 - $ 75 por vehículo mensual |
| Dispositivos de registro electrónico | $ 200 - $ 500 por dispositivo |
Relaciones establecidas de clientes como barreras de entrada
Covenant Logistics Group reportó $ 1.05 mil millones en ingresos para 2022, con contratos de clientes a largo plazo que representan importantes desafíos de entrada al mercado para los nuevos competidores.
- Duración promedio del contrato: 3-5 años
- Tasa de retención de clientes: 85%
- Costos de cambio para los clientes: estimado $ 50,000 - $ 250,000
Covenant Logistics Group, Inc. (CVLG) - Porter's Five Forces: Competitive rivalry
Rivalry is intense due to prolonged industry overcapacity and muted freight demand in 2025. Management noted this environment, citing a prolonged period of overcapacity and muted demand when discussing third quarter 2025 results. Globally, the fleet size was up approximately 6.9% year-over-year while demand growth was only around 3% as of late 2025, which definitely deepens the oversupply situation. This pressure is evident in specific freight metrics; for example, van truckloads in October 2025 were down 11% year-over-year.
The company's Expedited segment saw utilization drop, indicating strong price competition. For the three months ended September 30, 2025, freight revenue in the Expedited segment decreased 8.2%. This revenue drop was driven by a 5.4% decrease in utilization per tractor per week, even with a small increase in freight revenue per total mile. This suggests shippers are holding firm on pricing, forcing asset-based carriers like Covenant Logistics Group to run equipment less efficiently.
Covenant Logistics Group reported TTM revenue of $1.15B as of September 2025, competing with much larger carriers. To put that scale in perspective against some peers, you see a significant gap in the market capitalization and overall revenue base. Covenant Logistics Group ranks No. 35 on the Transport Topics Top 100 list, while some of its top competitors operate at a much larger scale.
| Metric | Covenant Logistics Group (CVLG) | Top 10 Competitor Average | Example Large Competitor (Knight-Swift) |
| Trailing Twelve Months Revenue (Sep 2025) | $1.15B | $24.6B | $7.47B |
Asset-light segments, like Managed Freight, face competition from numerous brokerages and private fleets gaining share. While the Managed Freight segment showed revenue growth of 14.0% for the third quarter of 2025, this growth was tied to a large customer contract that will not continue into the fourth quarter. This highlights the transactional nature and intense competition in the brokerage space, where market share is constantly being fought over by a vast number of players, including private fleets expanding their logistics operations.
Here are a few key competitive data points from the recent reporting period:
- Expedited segment freight revenue decline (Q3 2025): $7.2 million
- Expedited segment utilization decrease (Q3 2025): 5.4%
- Dedicated segment tractor fleet increase (Q3 2025): 9.7% (136 units)
- Managed Freight segment revenue increase (Q3 2025): 14.0%
- CVLG total indebtedness, net of cash (Sep 30, 2025): approximately $268.3 million
Finance: draft 13-week cash view by Friday.
Covenant Logistics Group, Inc. (CVLG) - Porter's Five Forces: Threat of substitutes
You're looking at the competitive landscape for Covenant Logistics Group, Inc. (CVLG), and the threat of customers choosing a different way to move their goods-a substitute-is definitely a key factor. Honestly, while trucking is king, other modes are always lurking, ready to pull volume if the price or service alignment is right for their specific needs.
Rail freight remains a viable substitute, particularly when you're moving long-haul, non-time-sensitive, bulk cargo. This is where the rail networks shine on cost-per-ton. The United States Rail Freight Transport Market size is estimated to be about $71.77 billion in 2025. However, the overall tonnage share for railroads is actually projected to shrink slightly, falling from 10.6% in 2024 to 9.9% by 2035. This suggests that while rail is a major player, its overall market penetration in terms of weight isn't growing relative to trucking. Within that rail market, intermodal containers-which often involve a road leg, potentially using a carrier like Covenant Logistics Group, Inc. for the first or last mile-captured 46% of total rail freight volumes in 2024.
For Covenant Logistics Group, Inc.'s Expedited segment, the premium, time-critical substitute is air freight. When a shipment absolutely must be there tomorrow, air carriers become the default choice, regardless of the cost premium. We don't have precise 2025 market share data for air freight to compare directly against trucking or rail, but its role is clearly defined by urgency.
The trend of shippers bringing freight in-house presents a more direct, truck-based substitution threat. Companies are absorbing increased volumes themselves, diverting that freight from for-hire carriers. The National Private Truck Council's (NPTC's) 2025 Benchmarking Survey shows a significant commitment here: private fleets handle more than 70% of outbound shipments and 43% of inbound shipments. Furthermore, private fleet shipment volume increased by 11.7% year-over-year in 2025. This suggests that for some lanes, especially dedicated ones, Covenant Logistics Group, Inc. is competing against the customer's own assets. It's a tricky dynamic, especially since Covenant Logistics Group, Inc. itself is growing its Dedicated segment, which saw freight revenue increase by 10.2% in Q2 2025 and 10.8% in Q3 2025.
To put this all in perspective, the overall substitution threat from other modes is tempered by the sheer dominance of the road. Trucking still moves the vast majority of all US freight. The American Trucking Associations (ATA) projects this market share will hold over the next decade.
Here's a quick look at how the major modes stack up based on the latest available projections and 2024 data, which we assume is largely holding through 2025:
| Mode of Transport | Market Share (Tonnage, 2024/Projected) | Market Size (USD, 2025 Estimate) | Relevance to CVLG |
|---|---|---|---|
| Trucking (Road) | 72.7% (Tonnage) | Largest Category (50% of tonnage in 2024) | Core business, but competes with private fleets |
| Rail | Projected to fall to 9.9% by 2035 | $71.77 billion | Substitute for long-haul, non-time-sensitive, bulk |
| Air Freight | Not specified | Not specified | Premium substitute for Expedited segment |
The key takeaway for you is that while rail and air offer specific alternatives, the most immediate, tangible substitution pressure comes from shippers choosing to move their own freight. You see this play out in the competitive environment for non-specialized dedicated accounts, where utilization can dip, as seen by the 3.5% decrease in utilization in the Expedited segment in Q2 2025.
The scale of the trucking industry itself is massive, which limits the overall impact of non-trucking substitutes. Consider these points regarding the trucking sector's dominance:
- Trucking accounted for 76.9% of freight revenue in 2024.
- Covenant Logistics Group, Inc.'s TTM revenue as of September 30, 2025, was $1.15B.
- The company's Q2 2025 freight revenue hit an all-time high of $276.5 million.
- The ATA projects trucking volumes will grow 1.6% in 2025.
- Private fleets increased their shipment volume by 11.7% in 2025.
If onboarding takes 14+ days, churn risk rises, which is when a customer might decide to bring that freight in-house instead of relying on a for-hire carrier.
Covenant Logistics Group, Inc. (CVLG) - Porter's Five Forces: Threat of new entrants
You're looking at starting a new fleet operation today; the capital outlay alone is a massive hurdle. New entrants face steep initial costs just to acquire the necessary equipment to compete in the freight market.
High capital investment is required for Class 8 trucks, especially with rising equipment costs. A brand-new Class 8 truck, the backbone of long-haul operations, typically costs between $150,000 and $200,000, sometimes more, depending on specifications like sleeper cabs or advanced engine packages. To make matters tougher, new tariffs implemented starting October 1, 2025, on foreign-made heavy-duty trucks and components have exacerbated this, with building a Class 8 truck or tractor reportedly up to 24% more expensive since early 2025 due to these tariffs and rising raw material costs of 9% to 12%.
Regulatory compliance, safety standards, and insurance costs create significant barriers to entry. The new 25% tariff on imported Class 8 trucks and parts directly inflates the entry price for any new fleet owner looking to purchase new assets. Furthermore, the cost of liability insurance, a non-negotiable operational expense, continues to rise, demanding significant financial backing that startups often lack.
The persistent driver shortage makes securing labor capacity extremely difficult for startups. The American Trucking Associations (ATA) estimates the industry faces a shortfall of over 80,000 qualified drivers by the end of 2025. This gap means that even if you secure financing for trucks, finding and retaining enough qualified drivers-especially those with clean records and experience that underwriters prefer-is a major operational choke point. The long-term need is even starker; the industry must hire roughly 1.2 million new drivers over the next decade just to replace retirees and keep pace with baseline demand.
Covenant Logistics Group's established network and $268.3 million net indebtedness (Q3 2025) show the scale needed to compete. When you see a company like Covenant Logistics Group carrying net indebtedness of $268.3 million as of September 30, 2025, with a net indebtedness to total capitalization ratio of 38.8%, it illustrates the level of balance sheet strength required to weather market fluctuations and make necessary capital expenditures, such as fleet replacements. A startup simply cannot match that financial depth or the existing infrastructure required to service complex contracts.
Here's the quick math on the barriers facing a new entrant:
| Barrier Component | Metric/Data Point | Value/Amount | Source Year/Period |
|---|---|---|---|
| Capital Investment (New Truck) | Average New Class 8 Truck Cost | $150,000 to $200,000+ | Late 2025 Estimate |
| Capital Investment (Cost Inflation) | Increase in Building Cost Due to Tariffs | Up to 24% | Since Early 2025 |
| Regulatory/Equipment Cost | New Tariff on Imported Trucks/Parts | 25% | Effective Oct 1, 2025 |
| Labor Capacity | Estimated Driver Shortfall | Over 80,000 | End of 2025 Estimate |
| Labor Capacity (Long-Term Need) | Drivers Needed Over Next Decade (Replacement) | 1.2 million | Next Decade Projection |
| Established Scale Proxy | Covenant Logistics Group Net Indebtedness | $268.3 million | Q3 2025 |
The difficulty in establishing a competitive presence is compounded by the existing labor dynamics:
- Average age of a U.S. truck driver is over 48.
- High turnover rates persist, especially for long-haul.
- New driver training pipeline struggles to meet replacement needs.
- Regulatory compliance (e.g., Drug & Alcohol Clearinghouse) tightens the qualified pool.
These factors mean that while the threat of a small, agile startup is low, the barrier to entry is extremely high, favoring incumbents with deep capital reserves and established operational scale. Finance: draft 13-week cash view by Friday.
Disclaimer
All information, articles, and product details provided on this website are for general informational and educational purposes only. We do not claim any ownership over, nor do we intend to infringe upon, any trademarks, copyrights, logos, brand names, or other intellectual property mentioned or depicted on this site. Such intellectual property remains the property of its respective owners, and any references here are made solely for identification or informational purposes, without implying any affiliation, endorsement, or partnership.
We make no representations or warranties, express or implied, regarding the accuracy, completeness, or suitability of any content or products presented. Nothing on this website should be construed as legal, tax, investment, financial, medical, or other professional advice. In addition, no part of this site—including articles or product references—constitutes a solicitation, recommendation, endorsement, advertisement, or offer to buy or sell any securities, franchises, or other financial instruments, particularly in jurisdictions where such activity would be unlawful.
All content is of a general nature and may not address the specific circumstances of any individual or entity. It is not a substitute for professional advice or services. Any actions you take based on the information provided here are strictly at your own risk. You accept full responsibility for any decisions or outcomes arising from your use of this website and agree to release us from any liability in connection with your use of, or reliance upon, the content or products found herein.