
|
Valoración DCF de Chevron Corporation (CVX) |
Completamente Editable: Adáptelo A Sus Necesidades En Excel O Sheets
Diseño Profesional: Plantillas Confiables Y Estándares De La Industria
Predeterminadas Para Un Uso Rápido Y Eficiente
Compatible con MAC / PC, completamente desbloqueado
No Se Necesita Experiencia; Fáciles De Seguir
Chevron Corporation (CVX) Bundle
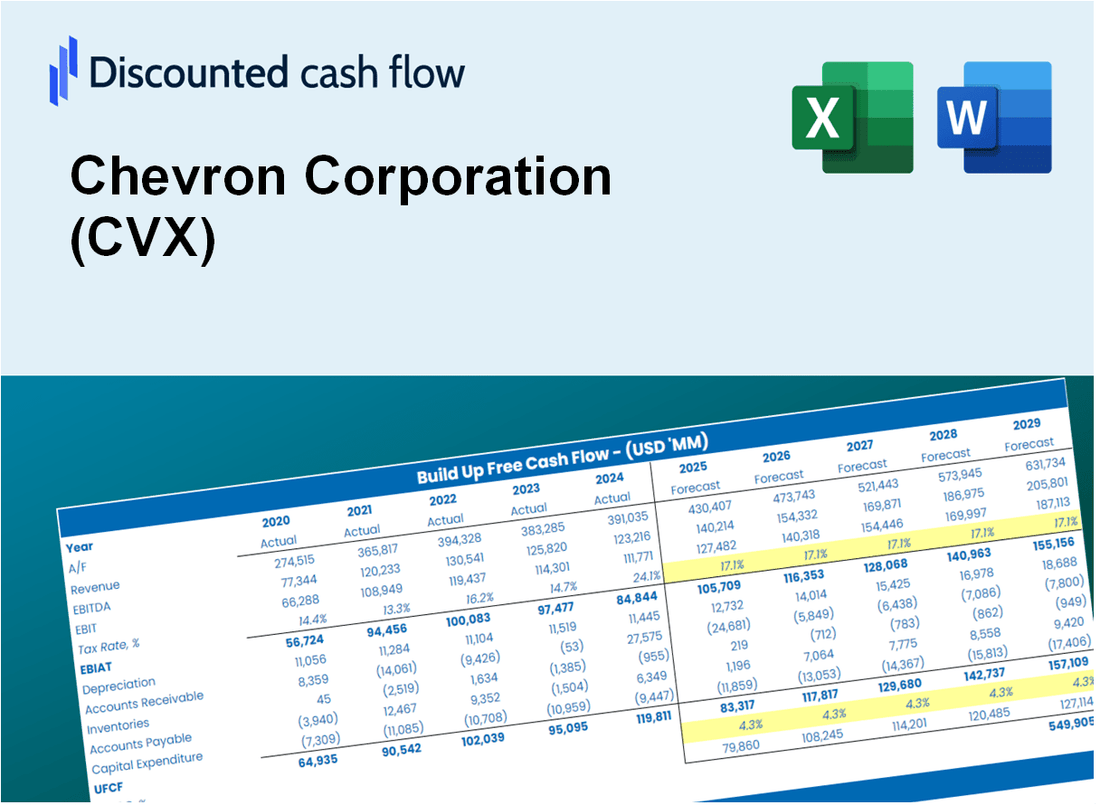
Diseñada para la precisión, nuestra calculadora DCF de Chevron Corporation (CVX) le permite evaluar la valoración de Chevron utilizando datos financieros del mundo real, al tiempo que ofrece una flexibilidad completa para modificar todos los parámetros clave para las proyecciones mejoradas.
What You Will Get
- Real Chevron Data: Preloaded financials – from revenue to EBIT – based on actual and projected figures for Chevron Corporation (CVX).
- Full Customization: Adjust all critical parameters (yellow cells) like WACC, growth %, and tax rates specific to Chevron Corporation (CVX).
- Instant Valuation Updates: Automatic recalculations to analyze the impact of changes on Chevron Corporation (CVX)’s fair value.
- Versatile Excel Template: Tailored for quick edits, scenario testing, and detailed projections for Chevron Corporation (CVX).
- Time-Saving and Accurate: Skip building models from scratch while maintaining precision and flexibility for Chevron Corporation (CVX).
Key Features
- 🔍 Real-Life CVX Financials: Pre-filled historical and projected data for Chevron Corporation (CVX).
- ✏️ Fully Customizable Inputs: Adjust all critical parameters (yellow cells) like WACC, growth %, and tax rates.
- 📊 Professional DCF Valuation: Built-in formulas calculate Chevron’s intrinsic value using the Discounted Cash Flow method.
- ⚡ Instant Results: Visualize Chevron’s valuation instantly after making changes.
- Scenario Analysis: Test and compare outcomes for various financial assumptions side-by-side.
How It Works
- Step 1: Download the Excel file.
- Step 2: Review pre-entered Chevron data (historical and projected).
- Step 3: Adjust key assumptions (yellow cells) based on your analysis.
- Step 4: View automatic recalculations for Chevron’s intrinsic value.
- Step 5: Use the outputs for investment decisions or reporting.
Why Choose the Chevron Corporation (CVX) Calculator?
- Accuracy: Utilizes real Chevron financials to ensure precise data.
- Flexibility: Tailored for users to easily adjust and test various inputs.
- Time-Saving: Avoid the complexity of creating a DCF model from the ground up.
- Professional-Grade: Crafted with the precision and usability expected by CFOs.
- User-Friendly: Simple to navigate, even for those lacking advanced financial modeling skills.
Who Should Use This Product?
- Energy Students: Explore energy market dynamics and apply valuation techniques using real-world data.
- Researchers: Integrate industry-specific models into academic studies or papers.
- Investors: Validate your investment strategies and assess valuation outcomes for Chevron Corporation (CVX).
- Financial Analysts: Enhance your analysis process with a ready-to-use, customizable DCF model.
- Entrepreneurs: Understand how major energy firms like Chevron are evaluated in the market.
What the Template Contains
- Operating and Balance Sheet Data: Pre-filled Chevron Corporation (CVX) historical data and forecasts, including revenue, EBITDA, EBIT, and capital expenditures.
- WACC Calculation: A dedicated sheet for Weighted Average Cost of Capital (WACC), including parameters like Beta, risk-free rate, and share price.
- DCF Valuation (Unlevered and Levered): Editable Discounted Cash Flow models showing intrinsic value with detailed calculations.
- Financial Statements: Pre-loaded financial statements (annual and quarterly) to support analysis.
- Key Ratios: Includes profitability, leverage, and efficiency ratios for Chevron Corporation (CVX).
- Dashboard and Charts: Visual summary of valuation outputs and assumptions to analyze results easily.
Disclaimer
All information, articles, and product details provided on this website are for general informational and educational purposes only. We do not claim any ownership over, nor do we intend to infringe upon, any trademarks, copyrights, logos, brand names, or other intellectual property mentioned or depicted on this site. Such intellectual property remains the property of its respective owners, and any references here are made solely for identification or informational purposes, without implying any affiliation, endorsement, or partnership.
We make no representations or warranties, express or implied, regarding the accuracy, completeness, or suitability of any content or products presented. Nothing on this website should be construed as legal, tax, investment, financial, medical, or other professional advice. In addition, no part of this site—including articles or product references—constitutes a solicitation, recommendation, endorsement, advertisement, or offer to buy or sell any securities, franchises, or other financial instruments, particularly in jurisdictions where such activity would be unlawful.
All content is of a general nature and may not address the specific circumstances of any individual or entity. It is not a substitute for professional advice or services. Any actions you take based on the information provided here are strictly at your own risk. You accept full responsibility for any decisions or outcomes arising from your use of this website and agree to release us from any liability in connection with your use of, or reliance upon, the content or products found herein.