
|
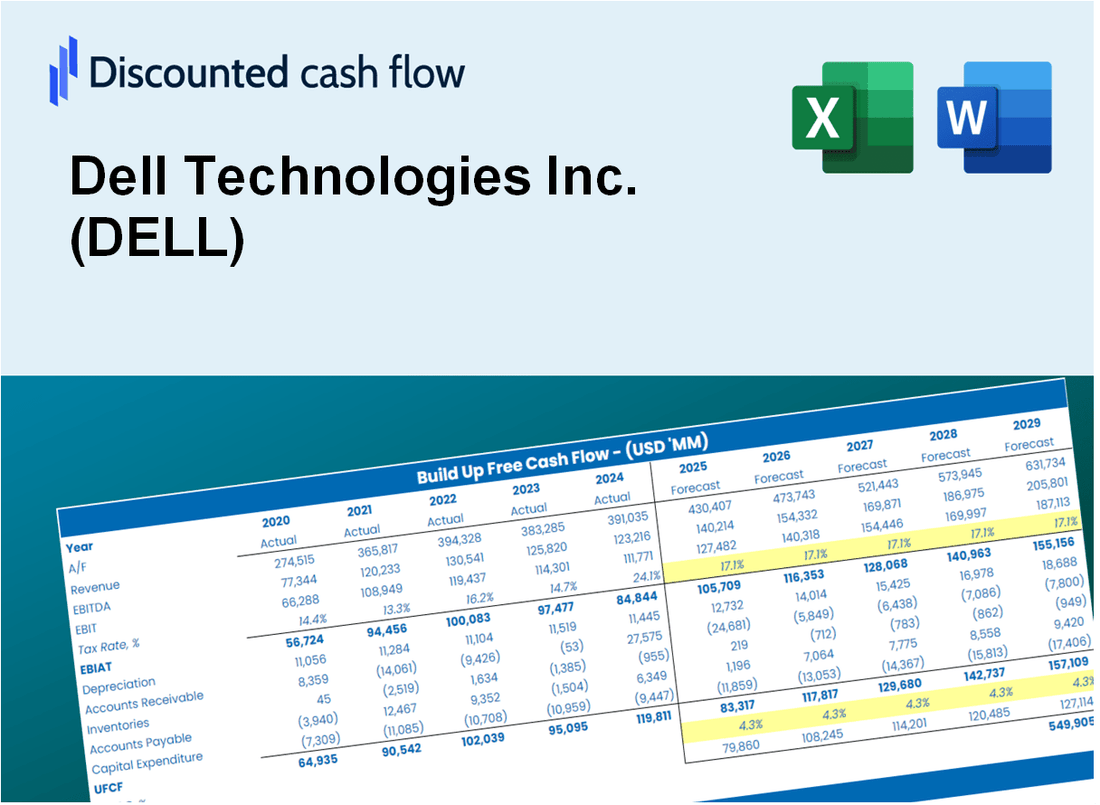
Valoración DCF de Dell Technologies Inc. (DELL) |
Completamente Editable: Adáptelo A Sus Necesidades En Excel O Sheets
Diseño Profesional: Plantillas Confiables Y Estándares De La Industria
Predeterminadas Para Un Uso Rápido Y Eficiente
Compatible con MAC / PC, completamente desbloqueado
No Se Necesita Experiencia; Fáciles De Seguir
Dell Technologies Inc. (DELL) Bundle
¡Agilice su análisis y mejore la precisión con nuestra calculadora DCF (Dell)! Utilizando datos reales de Dell Technologies Inc. y supuestos personalizables, esta herramienta le permite pronosticar, analizar y evaluar (Dell) como un inversor experimentado.
What You Will Receive
- Pre-Filled Financial Model: Dell’s actual data facilitates accurate DCF valuation.
- Comprehensive Forecast Control: Modify revenue growth, profit margins, WACC, and other essential metrics.
- Real-Time Calculations: Automatic updates provide immediate results as you adjust inputs.
- Investor-Ready Template: A polished Excel file crafted for professional-level valuation.
- Customizable and Reusable: Designed for adaptability, enabling repeated use for thorough forecasts.
Key Features
- Accurate Dell Financials: Gain access to reliable pre-loaded historical data and future forecasts.
- Adjustable Forecast Inputs: Modify yellow-highlighted cells such as WACC, growth rates, and profit margins.
- Real-Time Calculations: Automatic updates for DCF, Net Present Value (NPV), and cash flow assessments.
- Interactive Dashboard: User-friendly charts and summaries to effectively visualize your valuation outcomes.
- Designed for All Users: A straightforward, intuitive layout tailored for investors, CFOs, and consultants alike.
How It Works
- Step 1: Download the prebuilt Excel template with Dell Technologies Inc.'s (DELL) data included.
- Step 2: Explore the pre-filled sheets and familiarize yourself with the key metrics.
- Step 3: Update forecasts and assumptions in the editable yellow cells (WACC, growth, margins).
- Step 4: Instantly view recalculated results, including Dell Technologies Inc.'s (DELL) intrinsic value.
- Step 5: Make informed investment decisions or generate reports using the outputs.
Why Choose This Calculator?
- User-Friendly Interface: Perfect for both novices and seasoned professionals.
- Customizable Inputs: Adjust parameters easily to suit your financial analysis.
- Real-Time Adjustments: Observe immediate changes to Dell’s valuation as you modify inputs.
- Preloaded Data: Comes equipped with Dell’s actual financial metrics for fast evaluation.
- Relied Upon by Experts: Utilized by investors and analysts for making well-informed choices.
Who Should Use This Product?
- Investors: Accurately estimate Dell Technologies Inc.’s (DELL) fair value before making investment decisions.
- CFOs: Leverage a professional-grade DCF model for financial reporting and analysis specific to Dell Technologies Inc. (DELL).
- Consultants: Quickly adapt the template for valuation reports tailored to clients interested in Dell Technologies Inc. (DELL).
- Entrepreneurs: Gain insights into financial modeling practices utilized by industry leaders like Dell Technologies Inc. (DELL).
- Educators: Use it as a teaching tool to demonstrate valuation methodologies relevant to Dell Technologies Inc. (DELL).
What the Template Contains
- Historical Data: Includes Dell Technologies Inc.'s (DELL) past financials and baseline forecasts.
- DCF and Levered DCF Models: Detailed templates to calculate Dell Technologies Inc.'s (DELL) intrinsic value.
- WACC Sheet: Pre-built calculations for Weighted Average Cost of Capital.
- Editable Inputs: Modify key drivers like growth rates, EBITDA %, and CAPEX assumptions.
- Quarterly and Annual Statements: A complete breakdown of Dell Technologies Inc.'s (DELL) financials.
- Interactive Dashboard: Visualize valuation results and projections dynamically.
Disclaimer
All information, articles, and product details provided on this website are for general informational and educational purposes only. We do not claim any ownership over, nor do we intend to infringe upon, any trademarks, copyrights, logos, brand names, or other intellectual property mentioned or depicted on this site. Such intellectual property remains the property of its respective owners, and any references here are made solely for identification or informational purposes, without implying any affiliation, endorsement, or partnership.
We make no representations or warranties, express or implied, regarding the accuracy, completeness, or suitability of any content or products presented. Nothing on this website should be construed as legal, tax, investment, financial, medical, or other professional advice. In addition, no part of this site—including articles or product references—constitutes a solicitation, recommendation, endorsement, advertisement, or offer to buy or sell any securities, franchises, or other financial instruments, particularly in jurisdictions where such activity would be unlawful.
All content is of a general nature and may not address the specific circumstances of any individual or entity. It is not a substitute for professional advice or services. Any actions you take based on the information provided here are strictly at your own risk. You accept full responsibility for any decisions or outcomes arising from your use of this website and agree to release us from any liability in connection with your use of, or reliance upon, the content or products found herein.