
|
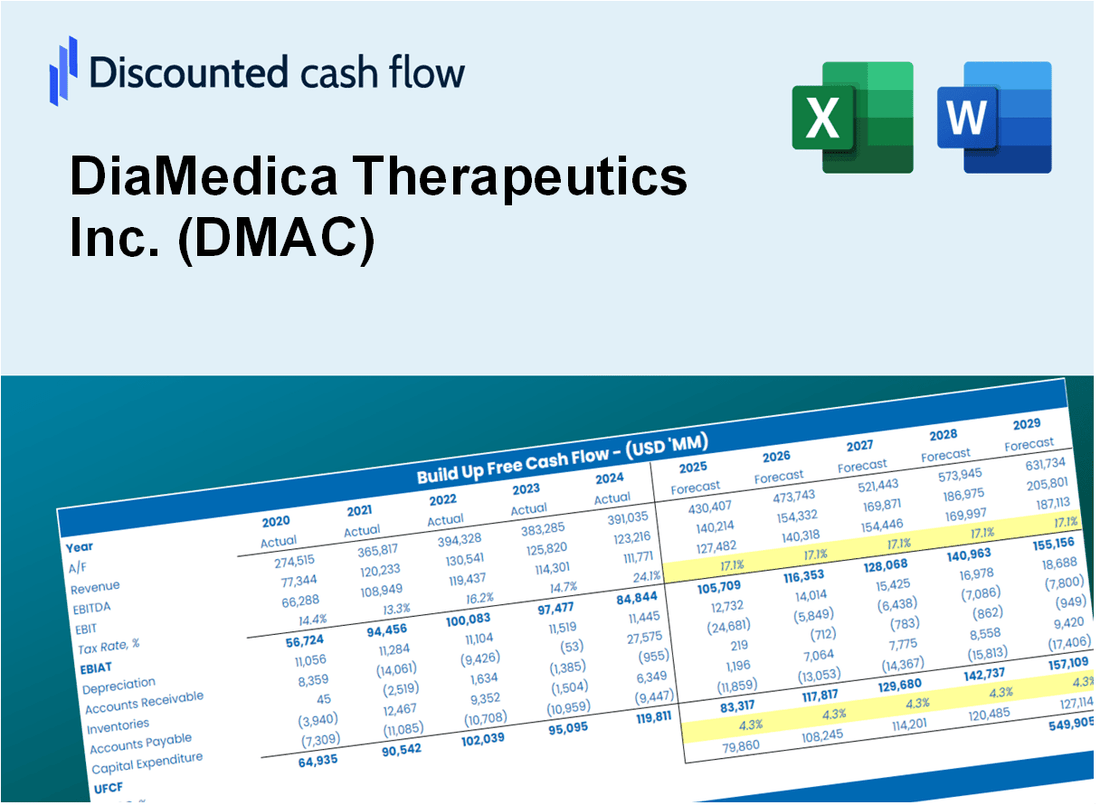
Valoración DCF de DiaMedica Therapeutics Inc. (DMAC) |
Completamente Editable: Adáptelo A Sus Necesidades En Excel O Sheets
Diseño Profesional: Plantillas Confiables Y Estándares De La Industria
Predeterminadas Para Un Uso Rápido Y Eficiente
Compatible con MAC / PC, completamente desbloqueado
No Se Necesita Experiencia; Fáciles De Seguir
DiaMedica Therapeutics Inc. (DMAC) Bundle
¡Mejore sus opciones de inversión con la calculadora DCF de DiaMedica Therapeutics Inc. (DMAC)! Explore los datos financieros genuinos para DiaMedica, ajuste las proyecciones y gastos de crecimiento, y observe instantáneamente cómo estas alteraciones afectan el valor intrínseco de DMAC.
What You Will Get
- Editable Excel Template: A fully customizable Excel-based DCF Calculator featuring pre-filled real DMAC financials.
- Real-World Data: Historical data and forward-looking estimates (highlighted in the yellow cells).
- Forecast Flexibility: Modify forecast assumptions such as revenue growth, EBITDA %, and WACC.
- Automatic Calculations: Instantly observe the impact of your inputs on DiaMedica's valuation.
- Professional Tool: Designed for investors, CFOs, consultants, and financial analysts.
- User-Friendly Design: Organized for clarity and ease of use, complete with step-by-step instructions.
Key Features
- 🔍 Real-Life DMAC Financials: Pre-filled historical and projected data for DiaMedica Therapeutics Inc.
- ✏️ Fully Customizable Inputs: Adjust all critical parameters (yellow cells) like WACC, growth %, and tax rates.
- 📊 Professional DCF Valuation: Built-in formulas calculate DiaMedica’s intrinsic value using the Discounted Cash Flow method.
- ⚡ Instant Results: Visualize DiaMedica’s valuation instantly after making changes.
- Scenario Analysis: Test and compare outcomes for various financial assumptions side-by-side.
How It Works
- Step 1: Download the prebuilt Excel template featuring DiaMedica Therapeutics Inc. (DMAC) data.
- Step 2: Navigate through the pre-filled sheets to grasp the essential metrics.
- Step 3: Modify forecasts and assumptions in the editable yellow cells (WACC, growth, margins).
- Step 4: Instantly access recalculated results, including DiaMedica’s intrinsic value.
- Step 5: Utilize the outputs to make informed investment choices or create reports.
Why Choose This Calculator for DiaMedica Therapeutics Inc. (DMAC)?
- Accurate Data: Utilize real DiaMedica financials for dependable valuation outcomes.
- Customizable: Tailor essential parameters such as growth rates, WACC, and tax rates to fit your forecasts.
- Time-Saving: Pre-configured calculations save you from starting from the ground up.
- Professional-Grade Tool: Crafted for investors, analysts, and consultants in the biotech sector.
- User-Friendly: Easy-to-navigate interface and clear instructions accommodate all users.
Who Should Use This Product?
- Investors: Evaluate DiaMedica Therapeutics Inc. (DMAC) for informed stock trading decisions.
- CFOs and Financial Analysts: Optimize valuation methodologies and validate financial forecasts.
- Startup Founders: Understand the valuation strategies of biotech firms like DiaMedica.
- Consultants: Provide comprehensive valuation analyses and reports for clients in the healthcare sector.
- Students and Educators: Utilize real-time data from DiaMedica to enhance learning in financial valuation practices.
What the Template Contains
- Historical Data: Includes DiaMedica Therapeutics Inc.'s (DMAC) past financials and baseline forecasts.
- DCF and Levered DCF Models: Detailed templates to calculate DiaMedica's (DMAC) intrinsic value.
- WACC Sheet: Pre-built calculations for Weighted Average Cost of Capital.
- Editable Inputs: Modify key drivers like growth rates, EBITDA %, and CAPEX assumptions.
- Quarterly and Annual Statements: A complete breakdown of DiaMedica's (DMAC) financials.
- Interactive Dashboard: Visualize valuation results and projections dynamically.
Disclaimer
All information, articles, and product details provided on this website are for general informational and educational purposes only. We do not claim any ownership over, nor do we intend to infringe upon, any trademarks, copyrights, logos, brand names, or other intellectual property mentioned or depicted on this site. Such intellectual property remains the property of its respective owners, and any references here are made solely for identification or informational purposes, without implying any affiliation, endorsement, or partnership.
We make no representations or warranties, express or implied, regarding the accuracy, completeness, or suitability of any content or products presented. Nothing on this website should be construed as legal, tax, investment, financial, medical, or other professional advice. In addition, no part of this site—including articles or product references—constitutes a solicitation, recommendation, endorsement, advertisement, or offer to buy or sell any securities, franchises, or other financial instruments, particularly in jurisdictions where such activity would be unlawful.
All content is of a general nature and may not address the specific circumstances of any individual or entity. It is not a substitute for professional advice or services. Any actions you take based on the information provided here are strictly at your own risk. You accept full responsibility for any decisions or outcomes arising from your use of this website and agree to release us from any liability in connection with your use of, or reliance upon, the content or products found herein.