
|
Valoración DCF de Krispy Kreme, Inc. (DNUT) |
Completamente Editable: Adáptelo A Sus Necesidades En Excel O Sheets
Diseño Profesional: Plantillas Confiables Y Estándares De La Industria
Predeterminadas Para Un Uso Rápido Y Eficiente
Compatible con MAC / PC, completamente desbloqueado
No Se Necesita Experiencia; Fáciles De Seguir
Krispy Kreme, Inc. (DNUT) Bundle
¡Explore el potencial financiero de Krispy Kreme, Inc. (DNUT) con nuestra calculadora DCF fácil de usar! Ingrese sus proyecciones para el crecimiento, los márgenes y los gastos para determinar el valor intrínseco de Krispy Kreme y refinar su estrategia de inversión.
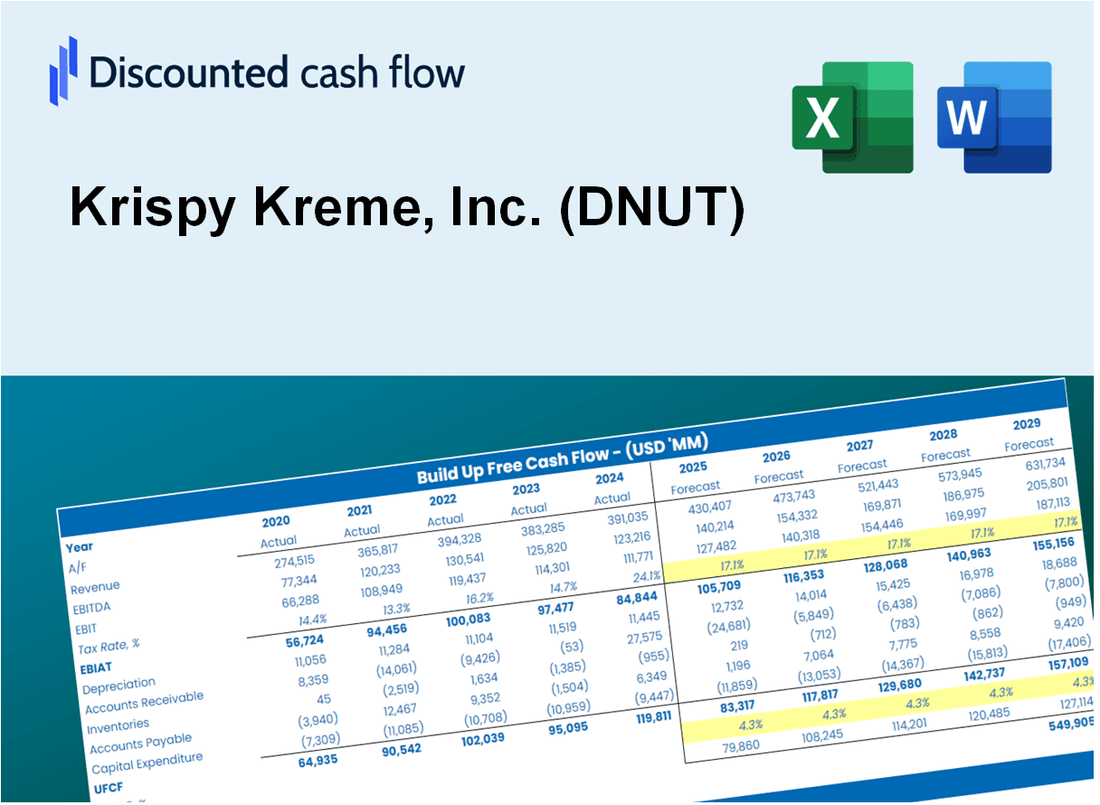
Discounted Cash Flow (DCF) - (USD MM)
| Year | AY1 2020 |
AY2 2021 |
AY3 2022 |
AY4 2023 |
AY5 2024 |
FY1 2025 |
FY2 2026 |
FY3 2027 |
FY4 2028 |
FY5 2029 |
|---|---|---|---|---|---|---|---|---|---|---|
| Revenue | 1,122.0 | 1,384.4 | 1,529.9 | 1,686.1 | 1,665.4 | 1,843.9 | 2,041.5 | 2,260.4 | 2,502.7 | 2,770.9 |
| Revenue Growth, % | 0 | 23.38 | 10.51 | 10.21 | -1.23 | 10.72 | 10.72 | 10.72 | 10.72 | 10.72 |
| EBITDA | 85.8 | 140.5 | 136.2 | 135.2 | 213.4 | 175.3 | 194.1 | 214.9 | 237.9 | 263.4 |
| EBITDA, % | 7.64 | 10.15 | 8.9 | 8.02 | 12.82 | 9.51 | 9.51 | 9.51 | 9.51 | 9.51 |
| Depreciation | 80.4 | 101.6 | 110.3 | 125.9 | 133.6 | 137.2 | 151.9 | 168.2 | 186.2 | 206.2 |
| Depreciation, % | 7.17 | 7.34 | 7.21 | 7.47 | 8.02 | 7.44 | 7.44 | 7.44 | 7.44 | 7.44 |
| EBIT | 5.4 | 38.9 | 25.9 | 9.3 | 79.8 | 38.1 | 42.2 | 46.7 | 51.7 | 57.3 |
| EBIT, % | 0.47957 | 2.81 | 1.7 | 0.55435 | 4.79 | 2.07 | 2.07 | 2.07 | 2.07 | 2.07 |
| Total Cash | 38.5 | 38.6 | 35.4 | 38.2 | 29.0 | 46.2 | 51.2 | 56.7 | 62.7 | 69.5 |
| Total Cash, percent | .0 | .0 | .0 | .0 | .0 | .0 | .0 | .0 | .0 | .0 |
| Account Receivables | 74.4 | 62.2 | 69.4 | 74.9 | 67.7 | 89.1 | 98.6 | 109.2 | 120.9 | 133.9 |
| Account Receivables, % | 6.63 | 4.49 | 4.53 | 4.44 | 4.07 | 4.83 | 4.83 | 4.83 | 4.83 | 4.83 |
| Inventories | 38.5 | 34.9 | 46.2 | 34.7 | 28.1 | 46.9 | 51.9 | 57.5 | 63.7 | 70.5 |
| Inventories, % | 3.43 | 2.52 | 3.02 | 2.06 | 1.69 | 2.54 | 2.54 | 2.54 | 2.54 | 2.54 |
| Accounts Payable | 148.6 | 182.1 | 225.3 | 156.5 | 123.3 | 213.2 | 236.1 | 261.4 | 289.4 | 320.4 |
| Accounts Payable, % | 13.25 | 13.15 | 14.72 | 9.28 | 7.4 | 11.56 | 11.56 | 11.56 | 11.56 | 11.56 |
| Capital Expenditure | -97.8 | -119.5 | -111.7 | -121.4 | -120.8 | -144.2 | -159.7 | -176.8 | -195.7 | -216.7 |
| Capital Expenditure, % | -8.72 | -8.63 | -7.3 | -7.2 | -7.25 | -7.82 | -7.82 | -7.82 | -7.82 | -7.82 |
| Tax Rate, % | 84.34 | 84.34 | 84.34 | 84.34 | 84.34 | 84.34 | 84.34 | 84.34 | 84.34 | 84.34 |
| EBITAT | 6.7 | 232.7 | 49.6 | 8.6 | 12.5 | 31.1 | 34.4 | 38.1 | 42.2 | 46.8 |
| Depreciation | ||||||||||
| Changes in Account Receivables | ||||||||||
| Changes in Inventories | ||||||||||
| Changes in Accounts Payable | ||||||||||
| Capital Expenditure | ||||||||||
| UFCF | 25.1 | 264.1 | 72.8 | -49.7 | 5.9 | 73.8 | 34.9 | 38.7 | 42.8 | 47.4 |
| WACC, % | 6.34 | 6.34 | 6.34 | 6.13 | 3.88 | 5.81 | 5.81 | 5.81 | 5.81 | 5.81 |
| PV UFCF | ||||||||||
| SUM PV UFCF | 203.6 | |||||||||
| Long Term Growth Rate, % | 2.00 | |||||||||
| Free cash flow (T + 1) | 48 | |||||||||
| Terminal Value | 1,270 | |||||||||
| Present Terminal Value | 958 | |||||||||
| Enterprise Value | 1,162 | |||||||||
| Net Debt | 1,324 | |||||||||
| Equity Value | -162 | |||||||||
| Diluted Shares Outstanding, MM | 172 | |||||||||
| Equity Value Per Share | -0.95 |
What You Will Get
- Pre-Filled Financial Model: Krispy Kreme’s real data facilitates accurate DCF valuation.
- Full Forecast Control: Modify revenue growth, profit margins, WACC, and other essential drivers.
- Instant Calculations: Real-time updates provide immediate results as you adjust inputs.
- Investor-Ready Template: A polished Excel file crafted for professional-level valuation.
- Customizable and Reusable: Designed for versatility, allowing repeated application for in-depth forecasts.
Key Features
- Authentic DNUT Data: Pre-loaded with Krispy Kreme’s historical performance metrics and future growth forecasts.
- Completely Customizable Variables: Modify sales growth, profit margins, discount rates, tax implications, and capital investments.
- Interactive Valuation Model: Instantaneous recalculations of Net Present Value (NPV) and intrinsic worth based on your adjustments.
- Forecast Scenario Analysis: Develop various projections to evaluate different valuation possibilities.
- Intuitive User Interface: Clean, organized, and tailored for both industry experts and novices.
How It Works
- Step 1: Download the Excel file.
- Step 2: Review pre-entered Krispy Kreme data (historical and projected).
- Step 3: Adjust key assumptions (yellow cells) based on your analysis.
- Step 4: View automatic recalculations for Krispy Kreme’s intrinsic value.
- Step 5: Use the outputs for investment decisions or reporting.
Why Choose This Calculator?
- Accurate Data: Authentic Krispy Kreme financials provide dependable valuation outcomes.
- Customizable: Tailor essential parameters like growth rates, WACC, and tax rates to align with your forecasts.
- Time-Saving: Pre-configured calculations save you from starting from the ground up.
- Professional-Grade Tool: Crafted for investors, analysts, and consultants in the industry.
- User-Friendly: Simple layout and guided instructions ensure ease of use for everyone.
Who Should Use This Product?
- Professional Investors: Develop comprehensive valuation models for assessing Krispy Kreme's market performance.
- Corporate Finance Teams: Evaluate valuation scenarios to inform strategic decisions within the company.
- Consultants and Advisors: Offer clients precise valuation insights for Krispy Kreme stock (DNUT).
- Students and Educators: Utilize real-world data to enhance learning and practice in financial modeling.
- Food Industry Analysts: Gain insights into how companies like Krispy Kreme are valued in the competitive market.
What the Template Contains
- Comprehensive DCF Model: Editable template with detailed valuation calculations tailored for Krispy Kreme, Inc. (DNUT).
- Real-World Data: Krispy Kreme’s historical and projected financials preloaded for analysis.
- Customizable Parameters: Adjust WACC, growth rates, and tax assumptions to test various scenarios.
- Financial Statements: Complete annual and quarterly breakdowns for deeper insights into Krispy Kreme's performance.
- Key Ratios: Built-in analysis for profitability, efficiency, and leverage specific to Krispy Kreme, Inc. (DNUT).
- Dashboard with Visual Outputs: Charts and tables for clear, actionable results related to Krispy Kreme’s financial health.
Disclaimer
All information, articles, and product details provided on this website are for general informational and educational purposes only. We do not claim any ownership over, nor do we intend to infringe upon, any trademarks, copyrights, logos, brand names, or other intellectual property mentioned or depicted on this site. Such intellectual property remains the property of its respective owners, and any references here are made solely for identification or informational purposes, without implying any affiliation, endorsement, or partnership.
We make no representations or warranties, express or implied, regarding the accuracy, completeness, or suitability of any content or products presented. Nothing on this website should be construed as legal, tax, investment, financial, medical, or other professional advice. In addition, no part of this site—including articles or product references—constitutes a solicitation, recommendation, endorsement, advertisement, or offer to buy or sell any securities, franchises, or other financial instruments, particularly in jurisdictions where such activity would be unlawful.
All content is of a general nature and may not address the specific circumstances of any individual or entity. It is not a substitute for professional advice or services. Any actions you take based on the information provided here are strictly at your own risk. You accept full responsibility for any decisions or outcomes arising from your use of this website and agree to release us from any liability in connection with your use of, or reliance upon, the content or products found herein.