
|
Mota-Engil, SGPS, S.A. (EGL.LS) Valoración de DCF |
Completamente Editable: Adáptelo A Sus Necesidades En Excel O Sheets
Diseño Profesional: Plantillas Confiables Y Estándares De La Industria
Predeterminadas Para Un Uso Rápido Y Eficiente
Compatible con MAC / PC, completamente desbloqueado
No Se Necesita Experiencia; Fáciles De Seguir
Mota-Engil, SGPS, S.A. (EGL.LS) Bundle
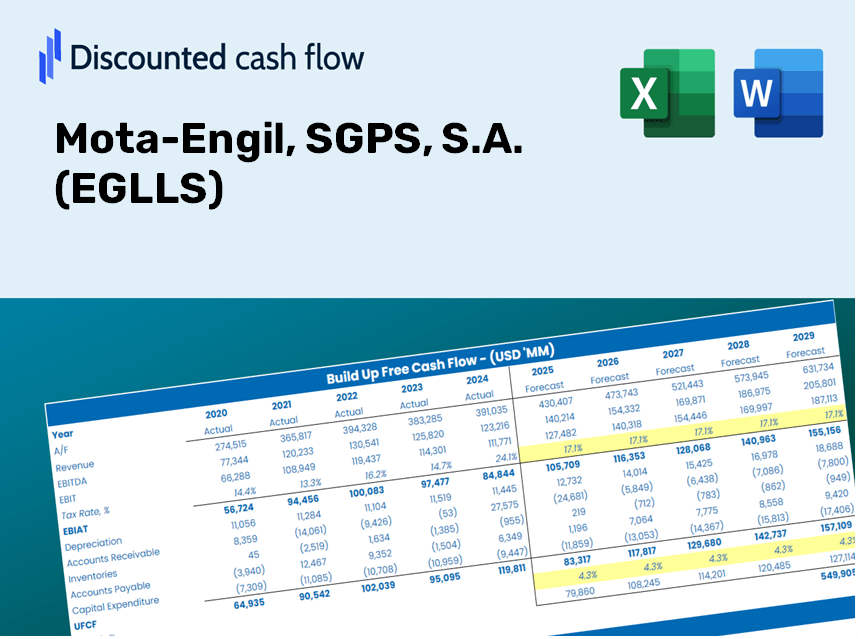
¡Simplifique la valoración de Mota-Engil, SGPS, S.A. (EGLLS) con esta calculadora DCF personalizable! Con Real Mota-Engil, SGPS, S.A. (EGLLS) Financials y entradas de pronóstico ajustables, puede probar escenarios y descubrir Mota-Engil, SGPS, S.A. (EGLL) Valor razonable en minutos.
Discounted Cash Flow (DCF) - (USD MM)
| Year | AY1 2020 |
AY2 2021 |
AY3 2022 |
AY4 2023 |
AY5 2024 |
FY1 2025 |
FY2 2026 |
FY3 2027 |
FY4 2028 |
FY5 2029 |
|---|---|---|---|---|---|---|---|---|---|---|
| Revenue | 2,429.1 | 2,591.8 | 3,804.3 | 5,551.9 | 5,950.9 | 7,536.9 | 9,545.5 | 12,089.5 | 15,311.4 | 19,392.1 |
| Revenue Growth, % | 0 | 6.7 | 46.78 | 45.94 | 7.19 | 26.65 | 26.65 | 26.65 | 26.65 | 26.65 |
| EBITDA | 415.5 | 521.7 | 654.9 | 1,020.5 | 1,095.5 | 1,375.4 | 1,741.9 | 2,206.1 | 2,794.1 | 3,538.7 |
| EBITDA, % | 17.1 | 20.13 | 17.22 | 18.38 | 18.41 | 18.25 | 18.25 | 18.25 | 18.25 | 18.25 |
| Depreciation | 196.7 | 210.3 | 278.7 | 281.4 | 297.7 | 506.6 | 641.6 | 812.6 | 1,029.2 | 1,303.4 |
| Depreciation, % | 8.1 | 8.11 | 7.32 | 5.07 | 5 | 6.72 | 6.72 | 6.72 | 6.72 | 6.72 |
| EBIT | 218.7 | 311.5 | 376.3 | 739.2 | 797.8 | 868.8 | 1,100.3 | 1,393.5 | 1,764.9 | 2,235.3 |
| EBIT, % | 9 | 12.02 | 9.89 | 13.31 | 13.41 | 11.53 | 11.53 | 11.53 | 11.53 | 11.53 |
| Total Cash | 470.9 | 474.9 | 807.7 | 816.9 | 553.7 | 1,250.5 | 1,583.8 | 2,005.9 | 2,540.5 | 3,217.6 |
| Total Cash, percent | .0 | .0 | .0 | .0 | .0 | .0 | .0 | .0 | .0 | .0 |
| Account Receivables | 1,606.3 | 1,803.8 | 1,990.5 | 2,325.5 | 2,790.1 | 4,172.7 | 5,284.8 | 6,693.2 | 8,477.0 | 10,736.2 |
| Account Receivables, % | 66.13 | 69.6 | 52.32 | 41.89 | 46.89 | 55.36 | 55.36 | 55.36 | 55.36 | 55.36 |
| Inventories | 283.7 | 347.9 | 627.4 | 606.7 | 407.4 | 894.9 | 1,133.4 | 1,435.5 | 1,818.1 | 2,302.6 |
| Inventories, % | 11.68 | 13.42 | 16.49 | 10.93 | 6.85 | 11.87 | 11.87 | 11.87 | 11.87 | 11.87 |
| Accounts Payable | 549.6 | 586.6 | 193.6 | 906.0 | 1,005.9 | 1,259.7 | 1,595.5 | 2,020.7 | 2,559.2 | 3,241.2 |
| Accounts Payable, % | 22.62 | 22.63 | 5.09 | 16.32 | 16.9 | 16.71 | 16.71 | 16.71 | 16.71 | 16.71 |
| Capital Expenditure | -199.3 | -180.1 | -257.4 | -455.3 | -420.1 | -560.4 | -709.8 | -899.0 | -1,138.6 | -1,442.0 |
| Capital Expenditure, % | -8.2 | -6.95 | -6.77 | -8.2 | -7.06 | -7.44 | -7.44 | -7.44 | -7.44 | -7.44 |
| Tax Rate, % | 70.16 | 70.16 | 70.16 | 70.16 | 70.16 | 70.16 | 70.16 | 70.16 | 70.16 | 70.16 |
| EBITAT | -170.8 | 61.7 | 141.8 | 211.4 | 238.1 | 201.5 | 255.2 | 323.2 | 409.3 | 518.4 |
| Depreciation | ||||||||||
| Changes in Account Receivables | ||||||||||
| Changes in Inventories | ||||||||||
| Changes in Accounts Payable | ||||||||||
| Capital Expenditure | ||||||||||
| UFCF | -1,513.8 | -132.7 | -696.1 | 435.5 | -49.7 | -1,468.7 | -827.9 | -1,048.5 | -1,328.0 | -1,681.9 |
| WACC, % | 3.68 | 5.37 | 6.9 | 6.12 | 6.23 | 5.66 | 5.66 | 5.66 | 5.66 | 5.66 |
| PV UFCF | ||||||||||
| SUM PV UFCF | -5,363.2 | |||||||||
| Long Term Growth Rate, % | 3.50 | |||||||||
| Free cash flow (T + 1) | -1,741 | |||||||||
| Terminal Value | -80,621 | |||||||||
| Present Terminal Value | -61,223 | |||||||||
| Enterprise Value | -66,586 | |||||||||
| Net Debt | 2,370 | |||||||||
| Equity Value | -68,956 | |||||||||
| Diluted Shares Outstanding, MM | 301 | |||||||||
| Equity Value Per Share | -229.33 |
Benefits You Will Receive
- Current Mota-Engil Financial Data: Pre-loaded with Mota-Engil’s historical and forecasted data for accurate analysis.
- Completely Customizable Template: Easily adjust critical variables such as revenue growth, WACC, and EBITDA margin.
- Instant Calculations: Watch Mota-Engil’s intrinsic value refresh automatically as you make adjustments.
- Professional Valuation Tool: Tailored for investors, analysts, and consultants looking for reliable DCF outputs.
- User-Centric Design: Intuitive layout and straightforward guidelines suitable for all skill levels.
Key Features
- Customizable Forecast Inputs: Adjust essential variables such as revenue growth, EBITDA percentages, and capital investments.
- Instant DCF Valuation: Quickly computes intrinsic value, NPV, and additional financial metrics.
- Top-Tier Accuracy: Incorporates Mota-Engil's actual financial data for credible valuation results.
- Simplified Scenario Analysis: Effortlessly evaluate various assumptions and analyze their impacts.
- Efficiency Booster: Avoid the hassle of constructing intricate valuation models from the ground up.
How It Works
- Step 1: Download the Excel file.
- Step 2: Examine the pre-filled data for Mota-Engil, SGPS, S.A. (EGLLS) including historical and projected figures.
- Step 3: Modify key assumptions (highlighted yellow cells) according to your analysis.
- Step 4: Observe automatic updates for Mota-Engil’s intrinsic value calculations.
- Step 5: Utilize the results to inform investment choices or for reporting purposes.
Why Select This Calculator for Mota-Engil, SGPS, S.A. (EGLLS)?
- Designed for Experts: A sophisticated tool utilized by industry analysts, CFOs, and consultants.
- Accurate Financial Data: Mota-Engil’s historical and projected financials are preloaded for precise calculations.
- Forecast Simulation: Effortlessly test various scenarios and assumptions.
- Comprehensive Outputs: Instantly calculates intrinsic value, NPV, and other essential metrics.
- User-Friendly: Detailed step-by-step instructions to seamlessly navigate the tool.
Who Can Benefit from Mota-Engil, SGPS, S.A. (EGLLS)?
- Investors: Make informed choices with the support of a trusted leader in construction and engineering.
- Financial Analysts: Streamline your analysis process with expert insights and industry benchmarks.
- Consultants: Easily modify reports and presentations to fit client needs with comprehensive data.
- Construction Industry Enthusiasts: Enhance your knowledge of infrastructure projects and market trends.
- Educators and Students: Utilize our resources for a hands-on approach in learning about civil engineering and project management.
What the Template Includes
- Preloaded EGLLS Data: Historical and projected financial metrics, encompassing revenue, EBIT, and capital expenditures.
- DCF and WACC Models: Advanced spreadsheets designed for calculating intrinsic value and Weighted Average Cost of Capital.
- Editable Inputs: Cells highlighted in yellow for modifying revenue growth, tax rates, and discount rates.
- Financial Statements: Detailed annual and quarterly financials for thorough analysis.
- Key Ratios: Profitability, leverage, and efficiency ratios for performance assessment.
- Dashboard and Charts: Visual representations of valuation results and underlying assumptions.
Disclaimer
All information, articles, and product details provided on this website are for general informational and educational purposes only. We do not claim any ownership over, nor do we intend to infringe upon, any trademarks, copyrights, logos, brand names, or other intellectual property mentioned or depicted on this site. Such intellectual property remains the property of its respective owners, and any references here are made solely for identification or informational purposes, without implying any affiliation, endorsement, or partnership.
We make no representations or warranties, express or implied, regarding the accuracy, completeness, or suitability of any content or products presented. Nothing on this website should be construed as legal, tax, investment, financial, medical, or other professional advice. In addition, no part of this site—including articles or product references—constitutes a solicitation, recommendation, endorsement, advertisement, or offer to buy or sell any securities, franchises, or other financial instruments, particularly in jurisdictions where such activity would be unlawful.
All content is of a general nature and may not address the specific circumstances of any individual or entity. It is not a substitute for professional advice or services. Any actions you take based on the information provided here are strictly at your own risk. You accept full responsibility for any decisions or outcomes arising from your use of this website and agree to release us from any liability in connection with your use of, or reliance upon, the content or products found herein.