
|
Valoración DCF de Entera Bio Ltd. (ENTX) |
Completamente Editable: Adáptelo A Sus Necesidades En Excel O Sheets
Diseño Profesional: Plantillas Confiables Y Estándares De La Industria
Predeterminadas Para Un Uso Rápido Y Eficiente
Compatible con MAC / PC, completamente desbloqueado
No Se Necesita Experiencia; Fáciles De Seguir
Entera Bio Ltd. (ENTX) Bundle
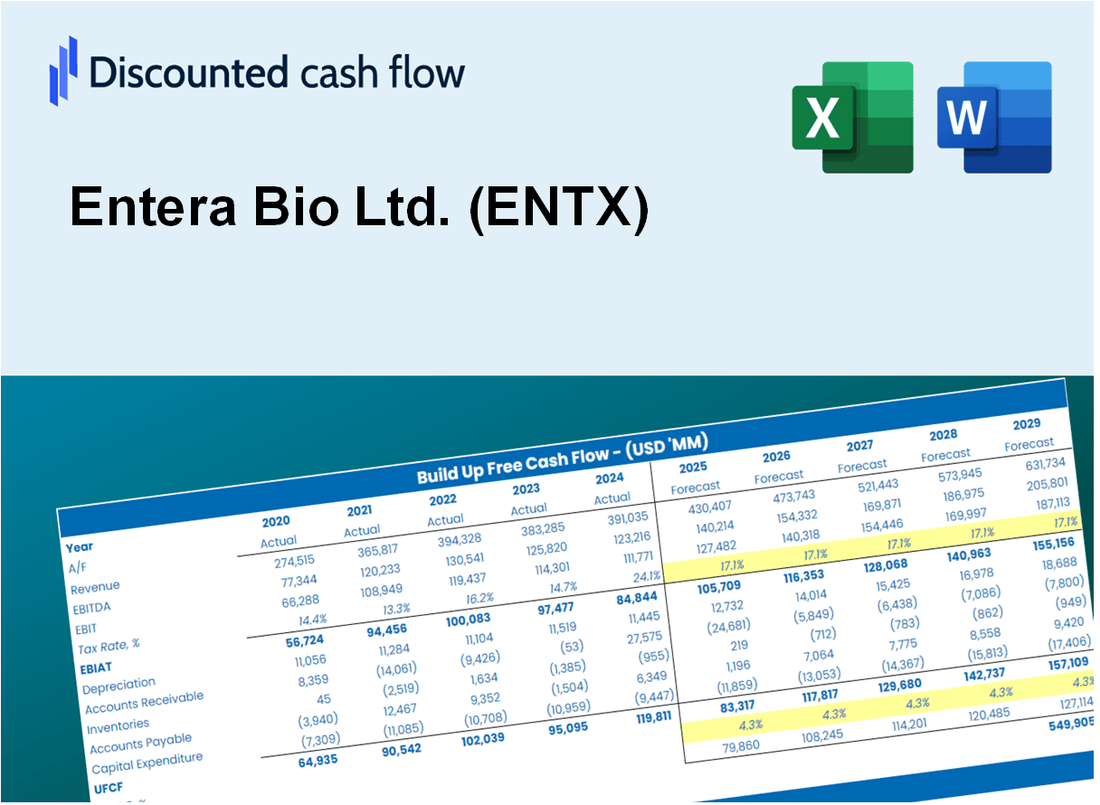
¡Mejore sus estrategias de inversión con la calculadora DCF de Entera Bio Ltd. (ENTX)! Explore los datos financieros reales para la biografía de Entera, ajuste las proyecciones y gastos de crecimiento, y observe cómo estos ajustes afectan el valor intrínseco de Enma Bio Ltd. (ENTX) en tiempo real.
Discounted Cash Flow (DCF) - (USD MM)
| Year | AY1 2020 |
AY2 2021 |
AY3 2022 |
AY4 2023 |
AY5 2024 |
FY1 2025 |
FY2 2026 |
FY3 2027 |
FY4 2028 |
FY5 2029 |
|---|---|---|---|---|---|---|---|---|---|---|
| Revenue | .4 | .6 | .1 | .0 | .2 | .1 | .1 | .1 | .0 | .0 |
| Revenue Growth, % | 0 | 56.44 | -76.53 | -100 | 0 | -30.02 | -30.02 | -30.02 | -30.02 | -30.02 |
| EBITDA | -11.1 | -12.2 | -12.9 | -8.8 | -9.5 | -.1 | -.1 | .0 | .0 | .0 |
| EBITDA, % | -3042.47 | -2130.3 | -9604.48 | 100 | -5270.17 | -60 | -60 | -60 | -60 | -60 |
| Depreciation | .1 | .1 | .1 | .1 | .0 | .1 | .0 | .0 | .0 | .0 |
| Depreciation, % | 17.26 | 9.28 | 47.76 | 100 | 25.41 | 39.94 | 39.94 | 39.94 | 39.94 | 39.94 |
| EBIT | -11.2 | -12.2 | -12.9 | -8.9 | -9.6 | -.1 | -.1 | .0 | .0 | .0 |
| EBIT, % | -3059.73 | -2139.58 | -9652.24 | 100 | -5295.58 | -60 | -60 | -60 | -60 | -60 |
| Total Cash | 8.6 | 24.9 | 12.3 | 11.0 | 8.7 | .1 | .1 | .1 | .0 | .0 |
| Total Cash, percent | .0 | .0 | .0 | .0 | .0 | .0 | .0 | .0 | .0 | .0 |
| Account Receivables | .3 | .2 | .2 | .0 | .1 | .1 | .1 | .0 | .0 | .0 |
| Account Receivables, % | 69.86 | 32.05 | 183.58 | 100 | 69.61 | 74.31 | 74.31 | 74.31 | 74.31 | 74.31 |
| Inventories | -.1 | .0 | -.3 | .0 | .0 | .0 | .0 | .0 | .0 | .0 |
| Inventories, % | -25.48 | 0 | -219.4 | 100 | 0 | -5.1 | -5.1 | -5.1 | -5.1 | -5.1 |
| Accounts Payable | .2 | .2 | .0 | .1 | .1 | .1 | .0 | .0 | .0 | .0 |
| Accounts Payable, % | 44.93 | 29.07 | 12.69 | 100 | 72.93 | 51.92 | 51.92 | 51.92 | 51.92 | 51.92 |
| Capital Expenditure | -.1 | .0 | .0 | .0 | .0 | .0 | .0 | .0 | .0 | .0 |
| Capital Expenditure, % | -14.52 | -2.98 | -35.07 | 100 | -1.66 | -10.85 | -10.85 | -10.85 | -10.85 | -10.85 |
| Tax Rate, % | -0.14695 | -0.14695 | -0.14695 | -0.14695 | -0.14695 | -0.14695 | -0.14695 | -0.14695 | -0.14695 | -0.14695 |
| EBITAT | -11.2 | -12.2 | -13.1 | -8.9 | -9.6 | -.1 | -.1 | .0 | .0 | .0 |
| Depreciation | ||||||||||
| Changes in Account Receivables | ||||||||||
| Changes in Inventories | ||||||||||
| Changes in Accounts Payable | ||||||||||
| Capital Expenditure | ||||||||||
| UFCF | -11.2 | -12.1 | -13.0 | -8.8 | -9.6 | -.1 | .0 | .0 | .0 | .0 |
| WACC, % | 11.63 | 11.63 | 11.63 | 11.63 | 11.63 | 11.63 | 11.63 | 11.63 | 11.63 | 11.63 |
| PV UFCF | ||||||||||
| SUM PV UFCF | -.1 | |||||||||
| Long Term Growth Rate, % | 2.00 | |||||||||
| Free cash flow (T + 1) | 0 | |||||||||
| Terminal Value | 0 | |||||||||
| Present Terminal Value | 0 | |||||||||
| Enterprise Value | 0 | |||||||||
| Net Debt | -8 | |||||||||
| Equity Value | 8 | |||||||||
| Diluted Shares Outstanding, MM | 38 | |||||||||
| Equity Value Per Share | 0.22 |
What You Will Receive
- Comprehensive Financial Model: Entera Bio Ltd.’s (ENTX) actual data facilitates accurate DCF valuation.
- Complete Forecast Control: Modify revenue growth, profit margins, WACC, and other essential factors.
- Real-Time Calculations: Automatic updates provide immediate results as adjustments are made.
- Professional-Grade Template: An optimized Excel file crafted for high-quality valuation.
- Flexible and Reusable: Designed for adaptability, allowing for repeated use in detailed forecasting.
Key Features
- Comprehensive Financial Data: Gain access to precise pre-loaded historical figures and future forecasts for Entera Bio Ltd. (ENTX).
- Adjustable Forecast Parameters: Modify highlighted cells for key metrics such as WACC, growth rates, and profit margins.
- Real-Time Calculations: Enjoy automatic updates for DCF, Net Present Value (NPV), and cash flow analyses.
- User-Friendly Dashboard: Clear and informative charts and summaries to help you visualize your valuation outcomes.
- Designed for All Users: An intuitive layout tailored for investors, CFOs, and consultants, whether experienced or new.
How It Works
- Step 1: Download the prebuilt Excel template featuring Entera Bio Ltd.'s (ENTX) data.
- Step 2: Review the pre-populated sheets to grasp the essential metrics.
- Step 3: Modify forecasts and assumptions in the editable yellow cells (WACC, growth, margins).
- Step 4: Instantly see recalibrated results, including Entera Bio Ltd.'s (ENTX) intrinsic value.
- Step 5: Make informed investment choices or create reports based on the results.
Why Choose Entera Bio Ltd. (ENTX)?
- Innovative Solutions: Leverage cutting-edge technology for advanced drug delivery systems.
- Proven Track Record: Backed by successful clinical trials and strong research foundations.
- Customizable Approaches: Adapt our solutions to meet your specific therapeutic needs.
- Clear Communication: Transparent reporting and insights for informed decision-making.
- Endorsed by Professionals: Trusted by leading experts in the biopharmaceutical industry.
Who Should Use Entera Bio Ltd. (ENTX)?
- Professional Investors: Develop comprehensive and accurate valuation models for investment assessments.
- Corporate Finance Teams: Evaluate valuation scenarios to inform strategic decisions within the company.
- Consultants and Advisors: Deliver precise valuation insights for Entera Bio Ltd. (ENTX) to clients.
- Students and Educators: Utilize real-world data to enhance learning and practice in financial modeling.
- Biotech Enthusiasts: Gain insights into how biotech firms like Entera Bio Ltd. (ENTX) are valued in the market.
What the Template Contains
- Preloaded ENTX Data: Historical and projected financial data, including revenue, EBIT, and capital expenditures.
- DCF and WACC Models: Professional-grade sheets for calculating intrinsic value and Weighted Average Cost of Capital.
- Editable Inputs: Yellow-highlighted cells for adjusting revenue growth, tax rates, and discount rates.
- Financial Statements: Comprehensive annual and quarterly financials for deeper analysis.
- Key Ratios: Profitability, leverage, and efficiency ratios to evaluate performance.
- Dashboard and Charts: Visual summaries of valuation outcomes and assumptions.
Disclaimer
All information, articles, and product details provided on this website are for general informational and educational purposes only. We do not claim any ownership over, nor do we intend to infringe upon, any trademarks, copyrights, logos, brand names, or other intellectual property mentioned or depicted on this site. Such intellectual property remains the property of its respective owners, and any references here are made solely for identification or informational purposes, without implying any affiliation, endorsement, or partnership.
We make no representations or warranties, express or implied, regarding the accuracy, completeness, or suitability of any content or products presented. Nothing on this website should be construed as legal, tax, investment, financial, medical, or other professional advice. In addition, no part of this site—including articles or product references—constitutes a solicitation, recommendation, endorsement, advertisement, or offer to buy or sell any securities, franchises, or other financial instruments, particularly in jurisdictions where such activity would be unlawful.
All content is of a general nature and may not address the specific circumstances of any individual or entity. It is not a substitute for professional advice or services. Any actions you take based on the information provided here are strictly at your own risk. You accept full responsibility for any decisions or outcomes arising from your use of this website and agree to release us from any liability in connection with your use of, or reliance upon, the content or products found herein.