
|
Valoración de DCF de EasyJet PLC (EZJ.L) |
Completamente Editable: Adáptelo A Sus Necesidades En Excel O Sheets
Diseño Profesional: Plantillas Confiables Y Estándares De La Industria
Predeterminadas Para Un Uso Rápido Y Eficiente
Compatible con MAC / PC, completamente desbloqueado
No Se Necesita Experiencia; Fáciles De Seguir
easyJet plc (EZJ.L) Bundle
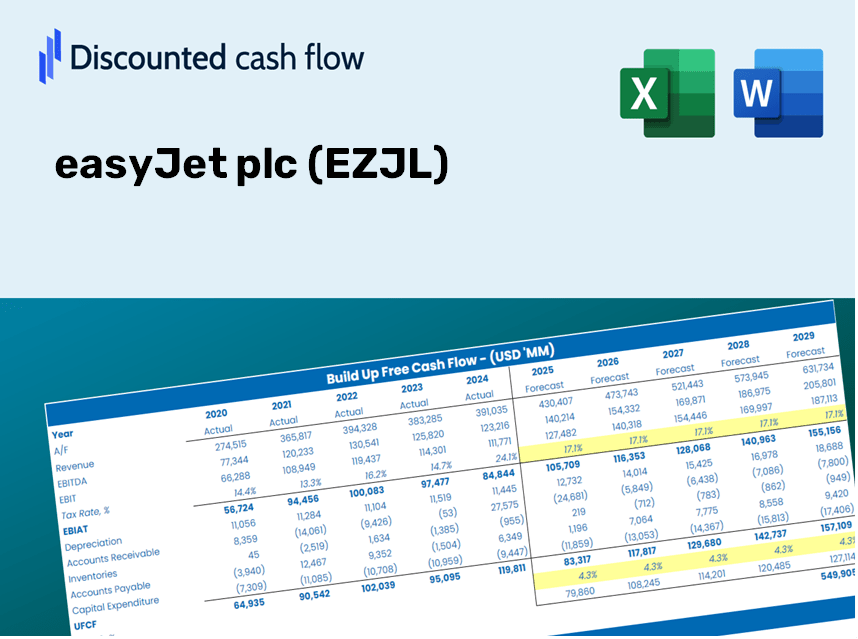
¡Mejore su estrategia de inversión con la calculadora DCF EasyJet PLC (EZJL)! Revise los datos financieros reales, ajuste las proyecciones y gastos de crecimiento, y observe instantáneamente cómo estos ajustes afectan el valor intrínseco de EasyJet PLC (EZJL).
What You Will Receive
- Genuine easyJet Data: Preloaded financial metrics – from revenue to EBIT – utilizing actual and projected figures.
- Comprehensive Customization: Modify all key parameters (yellow cells) including WACC, growth %, and tax rates.
- Immediate Valuation Updates: Automatic recalculations to assess the effect of changes on easyJet’s fair value.
- Flexible Excel Template: Designed for quick modifications, scenario analysis, and detailed forecasting.
- Efficient and Accurate: Avoid the hassle of building models from the ground up while ensuring precision and adaptability.
Key Features
- Pre-Loaded Data: easyJet plc’s historical financial statements and pre-filled forecasts.
- Fully Adjustable Inputs: Modify WACC, tax rates, revenue growth, and EBITDA margins as needed.
- Instant Results: Watch easyJet plc’s intrinsic value update in real time.
- Clear Visual Outputs: Dashboard charts illustrate valuation results and essential metrics.
- Built for Accuracy: A professional tool designed for analysts, investors, and finance professionals.
How It Works
- Step 1: Download the prebuilt Excel template that includes easyJet plc’s (EZJL) data.
- Step 2: Review the pre-filled sheets to familiarize yourself with the essential metrics.
- Step 3: Modify forecasts and assumptions in the editable yellow cells (WACC, growth, margins).
- Step 4: Immediately see the recalculated results, including easyJet plc’s (EZJL) intrinsic value.
- Step 5: Use the outputs to make well-informed investment decisions or create reports.
Why Opt for This easyJet plc (EZJL) Calculator?
- Precision: Utilizes accurate financial data from easyJet plc for reliable results.
- Versatility: Tailored for users to effortlessly adjust and experiment with parameters.
- Efficiency: Bypass the complexities of constructing a DCF model from the ground up.
- Expert-Quality: Crafted with the expertise and focus of top financial officers in mind.
- Intuitive: Simple to navigate, suitable for those without extensive financial modeling skills.
Who Should Consider Using This Product?
- Professional Investors: Develop comprehensive and accurate valuation models for portfolio assessment related to easyJet plc (EZJL).
- Corporate Finance Teams: Evaluate valuation scenarios to inform strategic decisions within the organization.
- Consultants and Advisors: Deliver precise valuation insights to clients focused on easyJet plc (EZJL) investments.
- Students and Educators: Utilize real-world data to enhance learning and practice in financial modeling.
- Aviation Enthusiasts: Gain insights into how airline companies like easyJet plc (EZJL) are valued in the market.
Contents of the Template
- Pre-Filled Data: Contains easyJet plc's (EZJL) historical financial information and future projections.
- Discounted Cash Flow Model: An editable DCF valuation model with automatic calculation features.
- Weighted Average Cost of Capital (WACC): A dedicated worksheet for determining WACC based on user-defined inputs.
- Key Financial Ratios: Evaluate easyJet plc's (EZJL) profitability, efficiency, and financial leverage.
- Customizable Inputs: Easily adjust revenue growth rates, profit margins, and tax rates.
- Clear Dashboard: Visual representations and tables summarizing essential valuation findings.
Disclaimer
All information, articles, and product details provided on this website are for general informational and educational purposes only. We do not claim any ownership over, nor do we intend to infringe upon, any trademarks, copyrights, logos, brand names, or other intellectual property mentioned or depicted on this site. Such intellectual property remains the property of its respective owners, and any references here are made solely for identification or informational purposes, without implying any affiliation, endorsement, or partnership.
We make no representations or warranties, express or implied, regarding the accuracy, completeness, or suitability of any content or products presented. Nothing on this website should be construed as legal, tax, investment, financial, medical, or other professional advice. In addition, no part of this site—including articles or product references—constitutes a solicitation, recommendation, endorsement, advertisement, or offer to buy or sell any securities, franchises, or other financial instruments, particularly in jurisdictions where such activity would be unlawful.
All content is of a general nature and may not address the specific circumstances of any individual or entity. It is not a substitute for professional advice or services. Any actions you take based on the information provided here are strictly at your own risk. You accept full responsibility for any decisions or outcomes arising from your use of this website and agree to release us from any liability in connection with your use of, or reliance upon, the content or products found herein.