
|
Valoración DCF de Farmmi, Inc. (FAMI) |
Completamente Editable: Adáptelo A Sus Necesidades En Excel O Sheets
Diseño Profesional: Plantillas Confiables Y Estándares De La Industria
Predeterminadas Para Un Uso Rápido Y Eficiente
Compatible con MAC / PC, completamente desbloqueado
No Se Necesita Experiencia; Fáciles De Seguir
Farmmi, Inc. (FAMI) Bundle
¡Obtenga información sobre su análisis de valoración de Farmmi, Inc. (FAMI) con nuestra calculadora DCF de última generación! Prelabastado con datos reales (FAMI), esta plantilla de Excel le permite ajustar preventos y supuestos para un cálculo preciso del valor intrínseco de Farmmi, Inc.
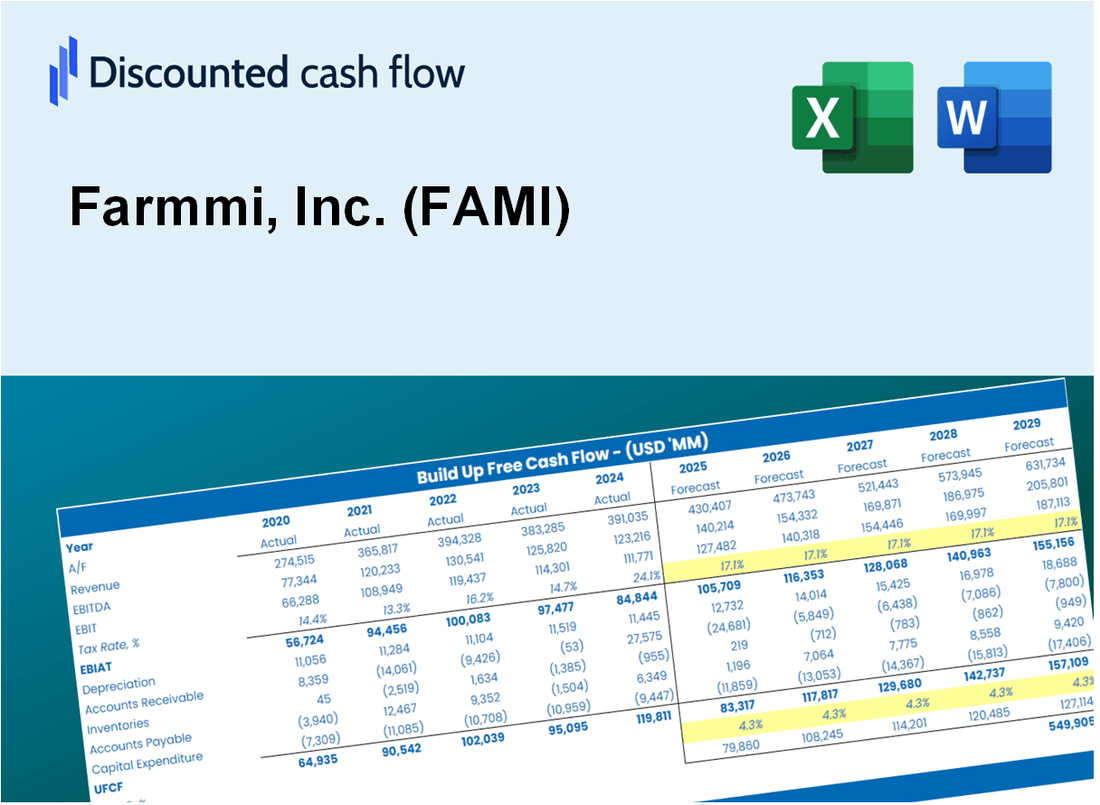
Discounted Cash Flow (DCF) - (USD MM)
| Year | AY1 2020 |
AY2 2021 |
AY3 2022 |
AY4 2023 |
AY5 2024 |
FY1 2025 |
FY2 2026 |
FY3 2027 |
FY4 2028 |
FY5 2029 |
|---|---|---|---|---|---|---|---|---|---|---|
| Revenue | 30.2 | 39.3 | 99.2 | 110.4 | 64.1 | 80.1 | 100.0 | 124.9 | 156.1 | 194.9 |
| Revenue Growth, % | 0 | 30.24 | 152.52 | 11.24 | -41.89 | 24.9 | 24.9 | 24.9 | 24.9 | 24.9 |
| EBITDA | 2.3 | 2.6 | 2.7 | 3.8 | -2.3 | 2.7 | 3.3 | 4.2 | 5.2 | 6.5 |
| EBITDA, % | 7.73 | 6.56 | 2.68 | 3.44 | -3.66 | 3.35 | 3.35 | 3.35 | 3.35 | 3.35 |
| Depreciation | .1 | .1 | .4 | .3 | .6 | .3 | .4 | .5 | .6 | .8 |
| Depreciation, % | 0.21623 | 0.17414 | 0.3708 | 0.26236 | 0.9179 | 0.38829 | 0.38829 | 0.38829 | 0.38829 | 0.38829 |
| EBIT | 2.3 | 2.5 | 2.3 | 3.5 | -2.9 | 2.4 | 3.0 | 3.7 | 4.6 | 5.8 |
| EBIT, % | 7.51 | 6.38 | 2.31 | 3.18 | -4.58 | 2.96 | 2.96 | 2.96 | 2.96 | 2.96 |
| Total Cash | .5 | 62.0 | 76.3 | 12.8 | .5 | 30.6 | 38.2 | 47.8 | 59.6 | 74.5 |
| Total Cash, percent | .0 | .0 | .0 | .0 | .0 | .0 | .0 | .0 | .0 | .0 |
| Account Receivables | 10.8 | 24.5 | 27.4 | 24.8 | 32.8 | 31.9 | 39.8 | 49.8 | 62.1 | 77.6 |
| Account Receivables, % | 35.66 | 62.29 | 27.6 | 22.46 | 51.1 | 39.82 | 39.82 | 39.82 | 39.82 | 39.82 |
| Inventories | .6 | 1.4 | .7 | 3.9 | 5.5 | 2.9 | 3.7 | 4.6 | 5.7 | 7.1 |
| Inventories, % | 1.93 | 3.49 | 0.72196 | 3.54 | 8.56 | 3.65 | 3.65 | 3.65 | 3.65 | 3.65 |
| Accounts Payable | .0 | .1 | .2 | 1.1 | .1 | .2 | .3 | .4 | .5 | .6 |
| Accounts Payable, % | 0.05548967 | 0.14369 | 0.1987 | 1 | 0.10915 | 0.30177 | 0.30177 | 0.30177 | 0.30177 | 0.30177 |
| Capital Expenditure | -.2 | .0 | .0 | .0 | .0 | -.1 | -.2 | -.2 | -.3 | -.3 |
| Capital Expenditure, % | -0.81955 | -0.01192671 | -0.00296936 | -0.000284510779 | -0.04592139 | -0.17613 | -0.17613 | -0.17613 | -0.17613 | -0.17613 |
| Tax Rate, % | -0.58716 | -0.58716 | -0.58716 | -0.58716 | -0.58716 | -0.58716 | -0.58716 | -0.58716 | -0.58716 | -0.58716 |
| EBITAT | 2.2 | 2.4 | 2.4 | 3.1 | -3.0 | 2.3 | 2.9 | 3.6 | 4.5 | 5.6 |
| Depreciation | ||||||||||
| Changes in Account Receivables | ||||||||||
| Changes in Inventories | ||||||||||
| Changes in Accounts Payable | ||||||||||
| Capital Expenditure | ||||||||||
| UFCF | -9.3 | -12.0 | .7 | 3.7 | -13.0 | 6.1 | -5.5 | -6.9 | -8.6 | -10.8 |
| WACC, % | 11.79 | 11.78 | 11.99 | 11.25 | 11.99 | 11.76 | 11.76 | 11.76 | 11.76 | 11.76 |
| PV UFCF | ||||||||||
| SUM PV UFCF | -15.7 | |||||||||
| Long Term Growth Rate, % | 1.00 | |||||||||
| Free cash flow (T + 1) | -11 | |||||||||
| Terminal Value | -101 | |||||||||
| Present Terminal Value | -58 | |||||||||
| Enterprise Value | -74 | |||||||||
| Net Debt | 15 | |||||||||
| Equity Value | -88 | |||||||||
| Diluted Shares Outstanding, MM | 7 | |||||||||
| Equity Value Per Share | -12.52 |
What You Will Get
- Real Farmmi Data: Preloaded financials – from revenue to EBIT – based on actual and projected figures for Farmmi, Inc. (FAMI).
- Full Customization: Adjust all critical parameters (yellow cells) like WACC, growth %, and tax rates specific to Farmmi.
- Instant Valuation Updates: Automatic recalculations to analyze the impact of changes on Farmmi’s fair value.
- Versatile Excel Template: Tailored for quick edits, scenario testing, and detailed projections for Farmmi, Inc. (FAMI).
- Time-Saving and Accurate: Skip building models from scratch while maintaining precision and flexibility for your analyses on Farmmi.
Key Features
- Comprehensive DCF Calculator: Features detailed unlevered and levered DCF valuation models tailored for Farmmi, Inc. (FAMI).
- WACC Calculator: Comes with a pre-built Weighted Average Cost of Capital sheet that allows for customizable inputs specific to Farmmi, Inc. (FAMI).
- Adjustable Forecast Assumptions: Easily modify growth rates, capital expenditures, and discount rates relevant to Farmmi, Inc. (FAMI).
- Integrated Financial Ratios: Assess profitability, leverage, and efficiency ratios specifically for Farmmi, Inc. (FAMI).
- Interactive Dashboard and Charts: Visual representations summarize essential valuation metrics for straightforward analysis of Farmmi, Inc. (FAMI).
How It Works
- Download: Get the pre-prepared Excel file containing Farmmi, Inc.'s (FAMI) financial data.
- Customize: Modify projections, such as revenue growth, EBITDA %, and WACC.
- Update Automatically: The intrinsic value and NPV calculations refresh in real-time.
- Test Scenarios: Develop various projections and instantly compare results.
- Make Decisions: Leverage the valuation findings to inform your investment approach.
Why Choose This Calculator for Farmmi, Inc. (FAMI)?
- All-in-One Solution: Offers DCF, WACC, and financial ratio analyses tailored for Farmmi, Inc. (FAMI).
- Flexible Input Options: Modify yellow-highlighted fields to explore different financial scenarios.
- In-Depth Analysis: Automatically computes Farmmi, Inc.'s (FAMI) intrinsic value and Net Present Value.
- Preloaded Market Data: Historical and projected data provide reliable benchmarks for analysis.
- Designed for Professionals: Perfect for financial analysts, investors, and business consultants focused on Farmmi, Inc. (FAMI).
Who Should Use Farmmi, Inc. (FAMI)?
- Investors: Gain insights into the agricultural sector with Farmmi's innovative solutions.
- Financial Analysts: Utilize comprehensive data analytics to assess market trends and company performance.
- Consultants: Tailor Farmmi's resources for impactful client strategies and presentations.
- Agriculture Enthusiasts: Explore advanced farming techniques and sustainability practices through real-world applications.
- Educators and Students: Incorporate Farmmi's offerings into academic programs focused on agriculture and business management.
What the Template Contains
- Comprehensive DCF Model: Editable template featuring detailed valuation calculations tailored for Farmmi, Inc. (FAMI).
- Real-World Data: Farmmi’s historical and projected financials preloaded for in-depth analysis.
- Customizable Parameters: Modify WACC, growth rates, and tax assumptions to explore various scenarios.
- Financial Statements: Complete annual and quarterly breakdowns for enhanced insights into Farmmi’s performance.
- Key Ratios: Integrated analysis focusing on profitability, efficiency, and leverage specific to Farmmi, Inc. (FAMI).
- Dashboard with Visual Outputs: Charts and tables designed to present clear, actionable results for stakeholders.
Disclaimer
All information, articles, and product details provided on this website are for general informational and educational purposes only. We do not claim any ownership over, nor do we intend to infringe upon, any trademarks, copyrights, logos, brand names, or other intellectual property mentioned or depicted on this site. Such intellectual property remains the property of its respective owners, and any references here are made solely for identification or informational purposes, without implying any affiliation, endorsement, or partnership.
We make no representations or warranties, express or implied, regarding the accuracy, completeness, or suitability of any content or products presented. Nothing on this website should be construed as legal, tax, investment, financial, medical, or other professional advice. In addition, no part of this site—including articles or product references—constitutes a solicitation, recommendation, endorsement, advertisement, or offer to buy or sell any securities, franchises, or other financial instruments, particularly in jurisdictions where such activity would be unlawful.
All content is of a general nature and may not address the specific circumstances of any individual or entity. It is not a substitute for professional advice or services. Any actions you take based on the information provided here are strictly at your own risk. You accept full responsibility for any decisions or outcomes arising from your use of this website and agree to release us from any liability in connection with your use of, or reliance upon, the content or products found herein.