
|
Valoración DCF de Diamondback Energy, Inc. (FANG) |
Completamente Editable: Adáptelo A Sus Necesidades En Excel O Sheets
Diseño Profesional: Plantillas Confiables Y Estándares De La Industria
Predeterminadas Para Un Uso Rápido Y Eficiente
Compatible con MAC / PC, completamente desbloqueado
No Se Necesita Experiencia; Fáciles De Seguir
Diamondback Energy, Inc. (FANG) Bundle
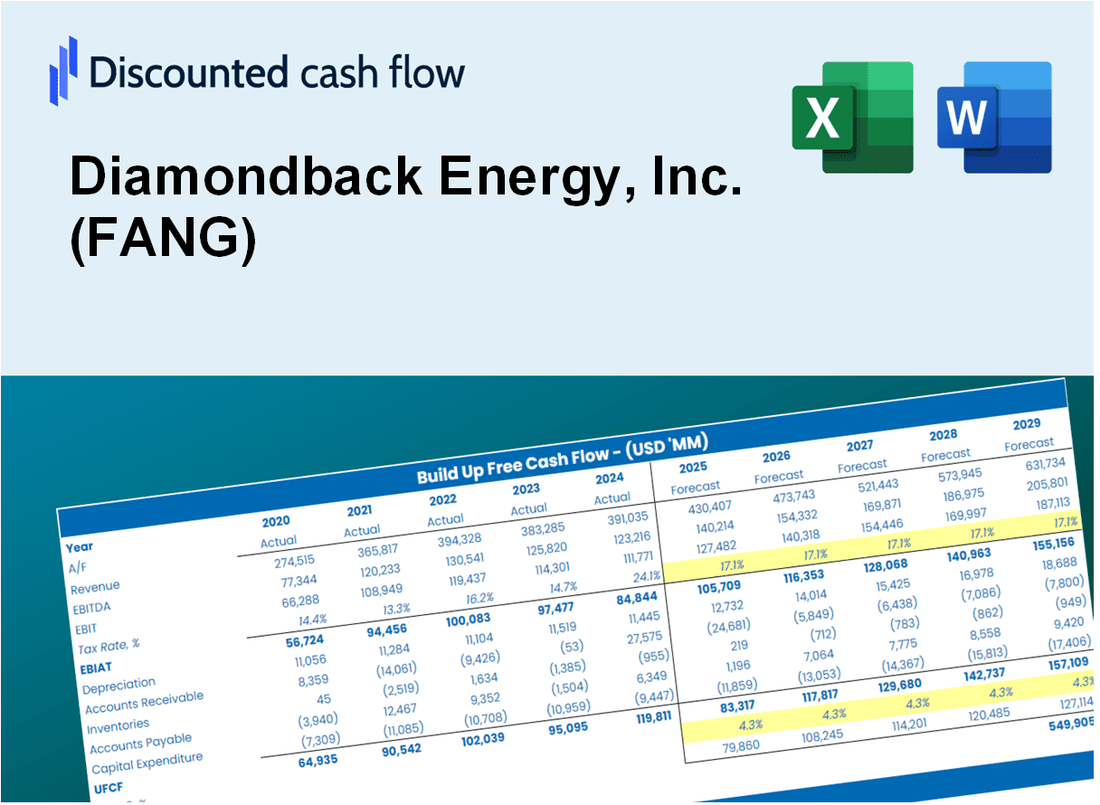
Independientemente de si es un inversor o un analista, esta calculadora DCF (FANG) es su recurso de referencia para una valoración precisa. Equipado con datos reales de Diamondback Energy, Inc., puede ajustar los pronósticos e inmediatamente observar los efectos.
What You Will Get
- Real FANG Financial Data: Pre-filled with Diamondback Energy’s historical and projected data for precise analysis.
- Fully Editable Template: Modify key inputs like revenue growth, WACC, and EBITDA % with ease.
- Automatic Calculations: See Diamondback Energy’s intrinsic value update instantly based on your changes.
- Professional Valuation Tool: Designed for investors, analysts, and consultants seeking accurate DCF results.
- User-Friendly Design: Simple structure and clear instructions for all experience levels.
Key Features
- Pre-Loaded Data: Diamondback Energy’s historical financial statements and pre-filled forecasts.
- Fully Adjustable Inputs: Modify WACC, tax rates, revenue growth, and EBITDA margins.
- Instant Results: View Diamondback Energy’s intrinsic value recalculating in real time.
- Clear Visual Outputs: Dashboard charts showcase valuation results and key metrics.
- Built for Accuracy: A professional tool tailored for analysts, investors, and finance experts.
How It Works
- 1. Access the Template: Download and open the Excel file containing Diamondback Energy's preloaded data.
- 2. Modify Assumptions: Adjust key inputs such as production growth, WACC, and capital expenditures.
- 3. View Results Instantly: The DCF model automatically calculates intrinsic value and NPV for (FANG).
- 4. Explore Scenarios: Analyze various forecasts to evaluate different valuation results.
- 5. Present with Assurance: Share professional valuation insights to bolster your decision-making for (FANG).
Why Choose This Calculator for Diamondback Energy, Inc. (FANG)?
- Designed for Industry Experts: A sophisticated tool tailored for analysts, CFOs, and energy consultants.
- Accurate Financial Data: Diamondback's historical and projected financials are preloaded for precision.
- Flexible Scenario Analysis: Effortlessly simulate various forecasts and assumptions.
- Comprehensive Outputs: Instantly calculates intrinsic value, NPV, and essential metrics.
- User-Friendly Interface: Step-by-step guidance ensures a smooth calculation process.
Who Should Use This Product?
- Individual Investors: Make informed decisions about buying or selling Diamondback Energy stock (FANG).
- Financial Analysts: Streamline valuation processes with ready-to-use financial models for Diamondback Energy (FANG).
- Consultants: Deliver professional valuation insights on Diamondback Energy (FANG) to clients quickly and accurately.
- Business Owners: Understand how energy companies like Diamondback Energy (FANG) are valued to guide your own strategy.
- Finance Students: Learn valuation techniques using real-world data and scenarios related to Diamondback Energy (FANG).
What the Template Contains
- Pre-Filled DCF Model: Diamondback Energy’s financial data preloaded for immediate use.
- WACC Calculator: Detailed calculations for Weighted Average Cost of Capital.
- Financial Ratios: Evaluate Diamondback Energy’s profitability, leverage, and efficiency.
- Editable Inputs: Change assumptions such as growth, margins, and CAPEX to fit your scenarios.
- Financial Statements: Annual and quarterly reports to support detailed analysis.
- Interactive Dashboard: Easily visualize key valuation metrics and results.
Disclaimer
All information, articles, and product details provided on this website are for general informational and educational purposes only. We do not claim any ownership over, nor do we intend to infringe upon, any trademarks, copyrights, logos, brand names, or other intellectual property mentioned or depicted on this site. Such intellectual property remains the property of its respective owners, and any references here are made solely for identification or informational purposes, without implying any affiliation, endorsement, or partnership.
We make no representations or warranties, express or implied, regarding the accuracy, completeness, or suitability of any content or products presented. Nothing on this website should be construed as legal, tax, investment, financial, medical, or other professional advice. In addition, no part of this site—including articles or product references—constitutes a solicitation, recommendation, endorsement, advertisement, or offer to buy or sell any securities, franchises, or other financial instruments, particularly in jurisdictions where such activity would be unlawful.
All content is of a general nature and may not address the specific circumstances of any individual or entity. It is not a substitute for professional advice or services. Any actions you take based on the information provided here are strictly at your own risk. You accept full responsibility for any decisions or outcomes arising from your use of this website and agree to release us from any liability in connection with your use of, or reliance upon, the content or products found herein.