
|
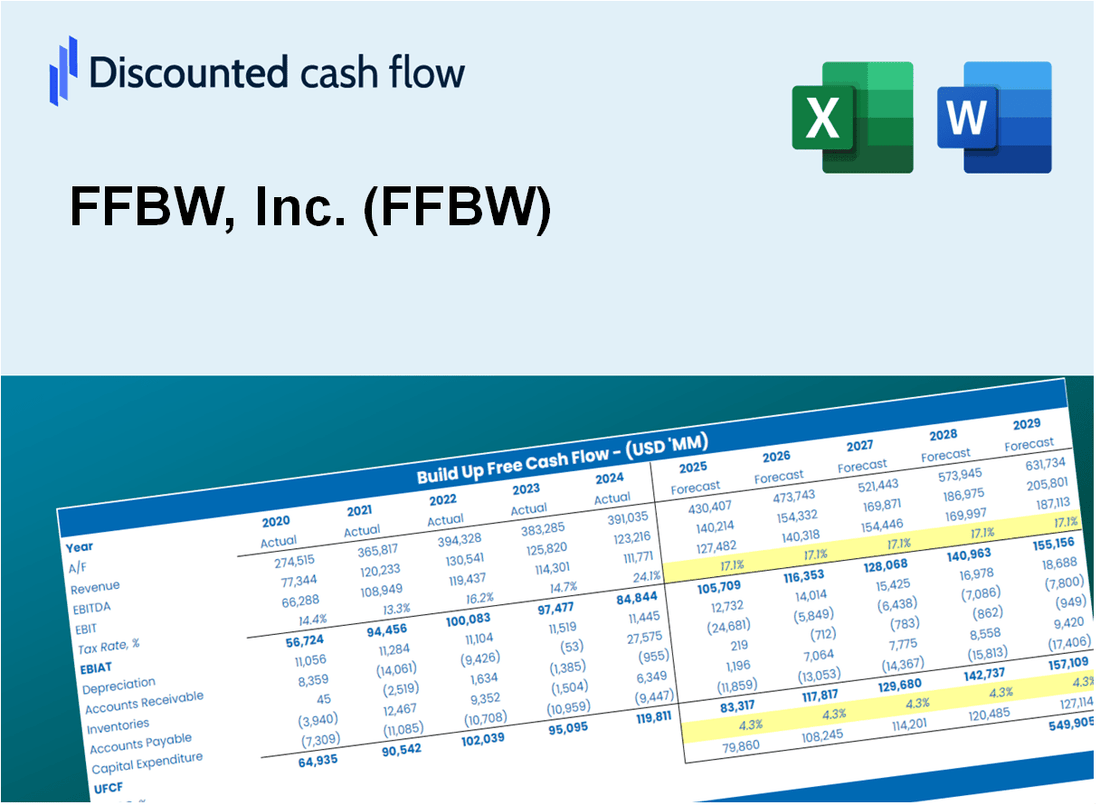
Valoración DCF de FFBW, Inc. (FFBW) |
Completamente Editable: Adáptelo A Sus Necesidades En Excel O Sheets
Diseño Profesional: Plantillas Confiables Y Estándares De La Industria
Predeterminadas Para Un Uso Rápido Y Eficiente
Compatible con MAC / PC, completamente desbloqueado
No Se Necesita Experiencia; Fáciles De Seguir
FFBW, Inc. (FFBW) Bundle
¡Mejore su estrategia de inversión con la calculadora DCF de FFBW, Inc. (FFBW)! Explore los datos financieros auténticos de FFBW, ajuste las proyecciones y gastos de crecimiento, y observe instantáneamente cómo estas modificaciones influyen en el valor intrínseco de FFBW, Inc. (FFBW).
What You Will Get
- Real FFBW Financial Data: Pre-filled with FFBW’s historical and projected data for precise analysis.
- Fully Editable Template: Modify key inputs like revenue growth, WACC, and EBITDA % with ease.
- Automatic Calculations: See FFBW’s intrinsic value update instantly based on your changes.
- Professional Valuation Tool: Designed for investors, analysts, and consultants seeking accurate DCF results.
- User-Friendly Design: Simple structure and clear instructions for all experience levels.
Key Features
- Comprehensive FFBW Data: Includes detailed historical financials and future projections for FFBW, Inc. (FFBW).
- Tailored Input Options: Modify key parameters such as revenue growth, profit margins, discount rates, tax rates, and capital expenditures.
- Interactive Valuation Model: Instant updates to Net Present Value (NPV) and intrinsic value based on your customized inputs.
- Flexible Scenario Analysis: Develop various forecasting scenarios to evaluate different valuation possibilities.
- Intuitive User Interface: Designed for ease of use, catering to both seasoned professionals and newcomers.
How It Works
- Step 1: Download the prebuilt Excel template featuring FFBW, Inc. (FFBW) data.
- Step 2: Review the pre-filled sheets to familiarize yourself with the essential metrics.
- Step 3: Adjust forecasts and assumptions in the editable yellow cells (WACC, growth, margins).
- Step 4: Instantly see recalculated results, including FFBW, Inc. (FFBW)'s intrinsic value.
- Step 5: Make well-informed investment decisions or create reports based on the outputs.
Why Choose This Calculator for FFBW, Inc. (FFBW)?
- User-Friendly Interface: Crafted for both novices and seasoned users.
- Customizable Inputs: Easily adjust parameters to suit your financial analysis.
- Real-Time Valuation: Watch FFBW’s valuation update instantly as you tweak the inputs.
- Preloaded Data: Comes equipped with FFBW’s latest financial metrics for immediate insights.
- Preferred by Experts: Utilized by financial professionals and analysts for strategic decision-making.
Who Should Use FFBW, Inc. (FFBW)?
- Individual Investors: Gain insights to make informed decisions regarding investments in FFBW stock.
- Financial Analysts: Enhance valuation accuracy with comprehensive financial models tailored for FFBW.
- Consultants: Provide clients with expert valuation analysis of FFBW efficiently and effectively.
- Business Owners: Learn from the valuation strategies of FFBW to inform your own business decisions.
- Finance Students: Explore valuation methodologies using FFBW as a case study for practical learning.
What the Template Contains
- Operating and Balance Sheet Data: Pre-filled FFBW, Inc. (FFBW) historical data and forecasts, including revenue, EBITDA, EBIT, and capital expenditures.
- WACC Calculation: A dedicated sheet for Weighted Average Cost of Capital (WACC), including parameters like Beta, risk-free rate, and share price.
- DCF Valuation (Unlevered and Levered): Editable Discounted Cash Flow models showing intrinsic value with detailed calculations.
- Financial Statements: Pre-loaded financial statements (annual and quarterly) to support analysis.
- Key Ratios: Includes profitability, leverage, and efficiency ratios for FFBW, Inc. (FFBW).
- Dashboard and Charts: Visual summary of valuation outputs and assumptions to analyze results easily.
Disclaimer
All information, articles, and product details provided on this website are for general informational and educational purposes only. We do not claim any ownership over, nor do we intend to infringe upon, any trademarks, copyrights, logos, brand names, or other intellectual property mentioned or depicted on this site. Such intellectual property remains the property of its respective owners, and any references here are made solely for identification or informational purposes, without implying any affiliation, endorsement, or partnership.
We make no representations or warranties, express or implied, regarding the accuracy, completeness, or suitability of any content or products presented. Nothing on this website should be construed as legal, tax, investment, financial, medical, or other professional advice. In addition, no part of this site—including articles or product references—constitutes a solicitation, recommendation, endorsement, advertisement, or offer to buy or sell any securities, franchises, or other financial instruments, particularly in jurisdictions where such activity would be unlawful.
All content is of a general nature and may not address the specific circumstances of any individual or entity. It is not a substitute for professional advice or services. Any actions you take based on the information provided here are strictly at your own risk. You accept full responsibility for any decisions or outcomes arising from your use of this website and agree to release us from any liability in connection with your use of, or reliance upon, the content or products found herein.