
|
Valoración DCF de Fair Isaac Corporation (FICO) |
Completamente Editable: Adáptelo A Sus Necesidades En Excel O Sheets
Diseño Profesional: Plantillas Confiables Y Estándares De La Industria
Predeterminadas Para Un Uso Rápido Y Eficiente
Compatible con MAC / PC, completamente desbloqueado
No Se Necesita Experiencia; Fáciles De Seguir
Fair Isaac Corporation (FICO) Bundle
¡Descubre el valor real de Fair Isaac Corporation (FICO) con nuestra calculadora DCF avanzada! Ajuste los supuestos críticos, explore diversos escenarios y evalúe cómo los diferentes factores influyen en la valoración de la Corporación Isaac (FICO) de la Corporación Justa (FICO): todo contenido dentro de una sola plantilla de Excel.
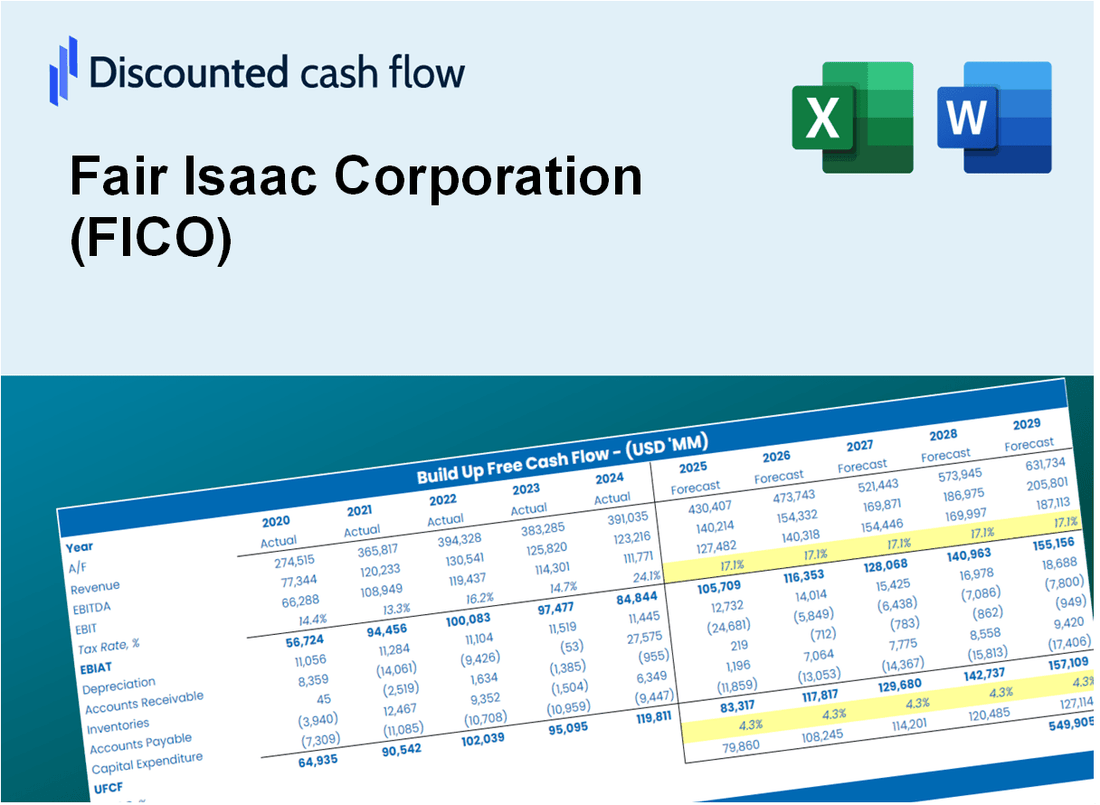
Discounted Cash Flow (DCF) - (USD MM)
| Year | AY1 2021 |
AY2 2022 |
AY3 2023 |
AY4 2024 |
AY5 2025 |
FY1 2026 |
FY2 2027 |
FY3 2028 |
FY4 2029 |
FY5 2030 |
|---|---|---|---|---|---|---|---|---|---|---|
| Revenue | 1,316.5 | 1,377.3 | 1,513.6 | 1,717.5 | 1,990.9 | 2,209.4 | 2,451.8 | 2,720.9 | 3,019.5 | 3,350.9 |
| Revenue Growth, % | 0 | 4.61 | 9.9 | 13.48 | 15.91 | 10.97 | 10.97 | 10.97 | 10.97 | 10.97 |
| EBITDA | 538.8 | 560.7 | 663.8 | 761.5 | 817.5 | 931.9 | 1,034.2 | 1,147.7 | 1,273.6 | 1,413.4 |
| EBITDA, % | 40.93 | 40.71 | 43.86 | 44.34 | 41.06 | 42.18 | 42.18 | 42.18 | 42.18 | 42.18 |
| Depreciation | 25.6 | 20.5 | 14.6 | 13.8 | 15.0 | 26.3 | 29.2 | 32.4 | 36.0 | 39.9 |
| Depreciation, % | 1.94 | 1.49 | 0.96713 | 0.80505 | 0.75103 | 1.19 | 1.19 | 1.19 | 1.19 | 1.19 |
| EBIT | 513.2 | 540.3 | 649.2 | 747.7 | 802.6 | 905.6 | 1,005.0 | 1,115.3 | 1,237.7 | 1,373.5 |
| EBIT, % | 38.98 | 39.23 | 42.89 | 43.53 | 40.31 | 40.99 | 40.99 | 40.99 | 40.99 | 40.99 |
| Total Cash | 195.4 | 133.2 | 136.8 | 150.7 | 134.1 | 216.8 | 240.6 | 267.0 | 296.3 | 328.8 |
| Total Cash, percent | .0 | .0 | .0 | .0 | .0 | .0 | .0 | .0 | .0 | .0 |
| Account Receivables | 312.1 | 322.4 | 387.9 | 426.6 | 529.1 | 548.7 | 608.9 | 675.7 | 749.9 | 832.2 |
| Account Receivables, % | 23.71 | 23.41 | 25.63 | 24.84 | 26.58 | 24.83 | 24.83 | 24.83 | 24.83 | 24.83 |
| Inventories | .0 | .0 | .0 | .0 | .0 | .0 | .0 | .0 | .0 | .0 |
| Inventories, % | 0 | 0 | 0 | 0 | 0 | 0 | 0 | 0 | 0 | 0 |
| Accounts Payable | 20.7 | 17.3 | 19.0 | 22.5 | 32.3 | 31.0 | 34.4 | 38.2 | 42.4 | 47.0 |
| Accounts Payable, % | 1.58 | 1.25 | 1.26 | 1.31 | 1.62 | 1.4 | 1.4 | 1.4 | 1.4 | 1.4 |
| Capital Expenditure | -7.6 | -6.0 | -4.2 | -25.6 | -8.9 | -14.3 | -15.8 | -17.6 | -19.5 | -21.6 |
| Capital Expenditure, % | -0.57492 | -0.43775 | -0.27994 | -1.49 | -0.44815 | -0.64568 | -0.64568 | -0.64568 | -0.64568 | -0.64568 |
| Tax Rate, % | 18.77 | 18.77 | 18.77 | 18.77 | 18.77 | 18.77 | 18.77 | 18.77 | 18.77 | 18.77 |
| EBITAT | 425.3 | 428.2 | 503.5 | 597.2 | 651.9 | 725.9 | 805.6 | 894.0 | 992.1 | 1,101.0 |
| Depreciation | ||||||||||
| Changes in Account Receivables | ||||||||||
| Changes in Inventories | ||||||||||
| Changes in Accounts Payable | ||||||||||
| Capital Expenditure | ||||||||||
| UFCF | 152.0 | 428.9 | 450.1 | 550.2 | 565.3 | 717.1 | 762.1 | 845.8 | 938.6 | 1,041.6 |
| WACC, % | 9.4 | 9.39 | 9.39 | 9.4 | 9.4 | 9.4 | 9.4 | 9.4 | 9.4 | 9.4 |
| PV UFCF | ||||||||||
| SUM PV UFCF | 3,258.4 | |||||||||
| Long Term Growth Rate, % | 4.00 | |||||||||
| Free cash flow (T + 1) | 1,083 | |||||||||
| Terminal Value | 20,071 | |||||||||
| Present Terminal Value | 12,810 | |||||||||
| Enterprise Value | 16,068 | |||||||||
| Net Debt | 2,941 | |||||||||
| Equity Value | 13,128 | |||||||||
| Diluted Shares Outstanding, MM | 25 | |||||||||
| Equity Value Per Share | 534.49 |
What You Will Receive
- Pre-Filled Financial Model: Fair Isaac Corporation’s (FICO) actual data facilitates accurate DCF valuation.
- Comprehensive Forecast Control: Modify revenue growth, profit margins, WACC, and other essential drivers.
- Real-Time Calculations: Automatic updates provide immediate results as adjustments are made.
- Investor-Ready Template: A polished Excel file crafted for high-quality valuation presentations.
- Customizable and Reusable: Designed for adaptability, allowing for repeated application in detailed forecasting.
Key Features
- Customizable Forecast Inputs: Adjust essential metrics such as revenue growth, EBITDA %, and capital investments.
- Instant DCF Valuation: Quickly computes intrinsic value, NPV, and additional financial metrics.
- High-Precision Accuracy: Leverages FICO's real-world financial data for dependable valuation results.
- Effortless Scenario Analysis: Easily evaluate various assumptions and analyze results side by side.
- Efficiency Booster: Remove the hassle of creating intricate valuation models from the ground up.
How It Works
- Step 1: Download the prebuilt Excel template featuring Fair Isaac Corporation’s (FICO) data.
- Step 2: Navigate through the pre-filled sheets to familiarize yourself with the essential metrics.
- Step 3: Modify forecasts and assumptions in the editable yellow cells (WACC, growth, margins).
- Step 4: Instantly see recalculated results, including Fair Isaac Corporation’s (FICO) intrinsic value.
- Step 5: Utilize the outputs to make informed investment decisions or generate detailed reports.
Why Choose the FICO Calculator?
- All-in-One Solution: Features advanced scoring algorithms, credit risk assessments, and predictive analytics.
- Flexible Parameters: Modify highlighted fields to explore different credit scenarios.
- In-Depth Analysis: Automatically computes FICO’s credit scores and risk metrics.
- Integrated Data: Access to historical and projected data for reliable analysis.
- Expert-Level Tool: Perfect for credit analysts, lenders, and financial advisors.
Who Should Use This Product?
- Professional Investors: Develop comprehensive and accurate valuation models for portfolio evaluation of Fair Isaac Corporation (FICO).
- Corporate Finance Teams: Examine valuation scenarios to inform strategic decisions within the organization.
- Consultants and Advisors: Deliver precise valuation insights for clients interested in Fair Isaac Corporation (FICO).
- Students and Educators: Utilize real-world data to enhance learning and practice in financial modeling.
- Tech Enthusiasts: Gain insights into how technology firms like Fair Isaac Corporation (FICO) are assessed in the marketplace.
What the Template Contains
- Pre-Filled DCF Model: Fair Isaac Corporation's (FICO) financial data preloaded for immediate use.
- WACC Calculator: Detailed calculations for Weighted Average Cost of Capital.
- Financial Ratios: Evaluate Fair Isaac Corporation's (FICO) profitability, leverage, and efficiency.
- Editable Inputs: Change assumptions such as growth, margins, and CAPEX to fit your scenarios.
- Financial Statements: Annual and quarterly reports to support detailed analysis.
- Interactive Dashboard: Easily visualize key valuation metrics and results.
Disclaimer
All information, articles, and product details provided on this website are for general informational and educational purposes only. We do not claim any ownership over, nor do we intend to infringe upon, any trademarks, copyrights, logos, brand names, or other intellectual property mentioned or depicted on this site. Such intellectual property remains the property of its respective owners, and any references here are made solely for identification or informational purposes, without implying any affiliation, endorsement, or partnership.
We make no representations or warranties, express or implied, regarding the accuracy, completeness, or suitability of any content or products presented. Nothing on this website should be construed as legal, tax, investment, financial, medical, or other professional advice. In addition, no part of this site—including articles or product references—constitutes a solicitation, recommendation, endorsement, advertisement, or offer to buy or sell any securities, franchises, or other financial instruments, particularly in jurisdictions where such activity would be unlawful.
All content is of a general nature and may not address the specific circumstances of any individual or entity. It is not a substitute for professional advice or services. Any actions you take based on the information provided here are strictly at your own risk. You accept full responsibility for any decisions or outcomes arising from your use of this website and agree to release us from any liability in connection with your use of, or reliance upon, the content or products found herein.