
|
Valoración DCF de FlexShopper, Inc. (FPAY) |
Completamente Editable: Adáptelo A Sus Necesidades En Excel O Sheets
Diseño Profesional: Plantillas Confiables Y Estándares De La Industria
Predeterminadas Para Un Uso Rápido Y Eficiente
Compatible con MAC / PC, completamente desbloqueado
No Se Necesita Experiencia; Fáciles De Seguir
FlexShopper, Inc. (FPAY) Bundle
¡Descubra el verdadero potencial de FlexShopper, Inc. (FPAY) con nuestra calculadora DCF avanzada! Ajuste los supuestos clave, explore varios escenarios y evalúe cómo los cambios afectan la valoración de FlexShopper, Inc. (FPAY): todo dentro de una plantilla de Excel conveniente.
What You Will Get
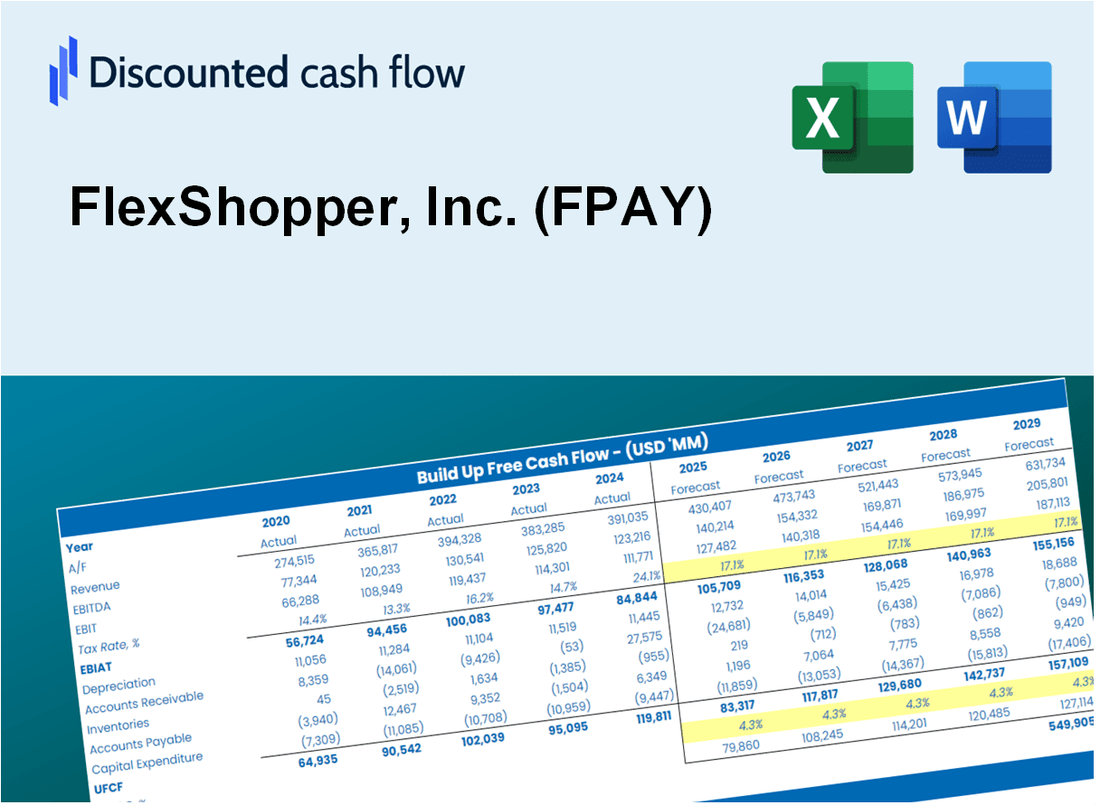
- Real FlexShopper Data: Preloaded financials – from revenue to EBIT – based on actual and projected figures for FlexShopper, Inc. (FPAY).
- Full Customization: Adjust all critical parameters (yellow cells) like WACC, growth %, and tax rates tailored for FlexShopper, Inc. (FPAY).
- Instant Valuation Updates: Automatic recalculations to analyze the impact of changes on FlexShopper, Inc. (FPAY)’s fair value.
- Versatile Excel Template: Tailored for quick edits, scenario testing, and detailed projections specifically for FlexShopper, Inc. (FPAY).
- Time-Saving and Accurate: Skip building models from scratch while maintaining precision and flexibility for FlexShopper, Inc. (FPAY).
Key Features
- Comprehensive DCF Calculator: Offers detailed unlevered and levered DCF valuation frameworks tailored for FlexShopper, Inc. (FPAY).
- WACC Calculator: Features a pre-configured Weighted Average Cost of Capital sheet with adjustable parameters.
- Customizable Forecast Assumptions: Adjust growth projections, capital expenditures, and discount rates as needed.
- Integrated Financial Ratios: Evaluate profitability, leverage, and efficiency ratios specific to FlexShopper, Inc. (FPAY).
- Interactive Dashboard and Charts: Visual representations provide a summary of essential valuation metrics for straightforward analysis.
How It Works
- Download: Obtain the comprehensive Excel file featuring FlexShopper, Inc.'s (FPAY) financial data.
- Customize: Modify projections, including revenue growth, EBITDA %, and WACC.
- Update Automatically: The intrinsic value and NPV calculations refresh in real-time.
- Test Scenarios: Develop various forecasts and instantly compare results.
- Make Decisions: Leverage the valuation outcomes to inform your investment strategy.
Why Choose FlexShopper, Inc. (FPAY) Calculator?
- Accuracy: Utilizes real FlexShopper financial data for precise calculations.
- Flexibility: Allows users to experiment with and adjust inputs effortlessly.
- Time-Saving: Avoid the complexities of creating a DCF model from the ground up.
- Professional-Grade: Crafted with the expertise and usability expected at the CFO level.
- User-Friendly: Intuitive design makes it accessible for users with varying financial backgrounds.
Who Should Use This Product?
- Individual Consumers: Make informed choices about utilizing FlexShopper's financing options for purchases.
- Retail Analysts: Enhance market assessments with comprehensive data on consumer finance trends.
- Financial Advisors: Provide clients with effective financing solutions and insights into FlexShopper's offerings.
- Small Business Owners: Learn how FlexShopper can help improve sales through flexible payment options.
- Finance Students: Gain practical knowledge of consumer finance and credit models using real-world examples.
What the Template Contains
- Preloaded FPAY Data: Historical and projected financial data, including revenue, EBIT, and capital expenditures.
- DCF and WACC Models: Professional-grade sheets for calculating intrinsic value and Weighted Average Cost of Capital.
- Editable Inputs: Yellow-highlighted cells for adjusting revenue growth, tax rates, and discount rates.
- Financial Statements: Comprehensive annual and quarterly financials for deeper analysis.
- Key Ratios: Profitability, leverage, and efficiency ratios to evaluate performance.
- Dashboard and Charts: Visual summaries of valuation outcomes and assumptions.
Disclaimer
All information, articles, and product details provided on this website are for general informational and educational purposes only. We do not claim any ownership over, nor do we intend to infringe upon, any trademarks, copyrights, logos, brand names, or other intellectual property mentioned or depicted on this site. Such intellectual property remains the property of its respective owners, and any references here are made solely for identification or informational purposes, without implying any affiliation, endorsement, or partnership.
We make no representations or warranties, express or implied, regarding the accuracy, completeness, or suitability of any content or products presented. Nothing on this website should be construed as legal, tax, investment, financial, medical, or other professional advice. In addition, no part of this site—including articles or product references—constitutes a solicitation, recommendation, endorsement, advertisement, or offer to buy or sell any securities, franchises, or other financial instruments, particularly in jurisdictions where such activity would be unlawful.
All content is of a general nature and may not address the specific circumstances of any individual or entity. It is not a substitute for professional advice or services. Any actions you take based on the information provided here are strictly at your own risk. You accept full responsibility for any decisions or outcomes arising from your use of this website and agree to release us from any liability in connection with your use of, or reliance upon, the content or products found herein.