
|
Valoración DCF de First Seacoast Bancorp, Inc. (FSEA) |
Completamente Editable: Adáptelo A Sus Necesidades En Excel O Sheets
Diseño Profesional: Plantillas Confiables Y Estándares De La Industria
Predeterminadas Para Un Uso Rápido Y Eficiente
Compatible con MAC / PC, completamente desbloqueado
No Se Necesita Experiencia; Fáciles De Seguir
First Seacoast Bancorp, Inc. (FSEA) Bundle
¡Mejore sus estrategias de inversión con la primera calculadora DCF de Seacoast Bancorp, Inc. (FSEA)! Sumérgete en la auténtica First Seacoast Financials, ajusta las proyecciones y gastos de crecimiento, y observa instantáneamente cómo estas modificaciones afectan el valor intrínseco de (FSEA).
Discounted Cash Flow (DCF) - (USD MM)
| Year | AY1 2020 |
AY2 2021 |
AY3 2022 |
AY4 2023 |
AY5 2024 |
FY1 2025 |
FY2 2026 |
FY3 2027 |
FY4 2028 |
FY5 2029 |
|---|---|---|---|---|---|---|---|---|---|---|
| Revenue | 17.7 | 17.5 | 17.3 | 18.4 | 26.7 | 30.0 | 33.7 | 37.8 | 42.5 | 47.7 |
| Revenue Growth, % | 0 | -0.73538 | -1.33 | 6.24 | 45.07 | 12.31 | 12.31 | 12.31 | 12.31 | 12.31 |
| EBITDA | 1.6 | 3.8 | -.5 | -6.2 | .4 | -.3 | -.3 | -.3 | -.4 | -.4 |
| EBITDA, % | 9.23 | 21.56 | -2.85 | -33.85 | 1.49 | -0.88511 | -0.88511 | -0.88511 | -0.88511 | -0.88511 |
| Depreciation | .6 | .6 | .5 | .5 | .4 | .8 | .9 | 1.0 | 1.2 | 1.3 |
| Depreciation, % | 3.26 | 3.2 | 3.01 | 2.64 | 1.44 | 2.71 | 2.71 | 2.71 | 2.71 | 2.71 |
| EBIT | 1.1 | 3.2 | -1.0 | -6.7 | .0 | -1.1 | -1.2 | -1.4 | -1.5 | -1.7 |
| EBIT, % | 5.97 | 18.36 | -5.87 | -36.49 | 0.05246393 | -3.6 | -3.6 | -3.6 | -3.6 | -3.6 |
| Total Cash | 64.0 | 99.2 | 115.1 | 127.9 | 127.3 | 30.0 | 33.7 | 37.8 | 42.5 | 47.7 |
| Total Cash, percent | .0 | .0 | .0 | .0 | .0 | .0 | .0 | .0 | .0 | .0 |
| Account Receivables | 1.4 | 1.5 | 2.0 | 2.3 | 2.1 | 2.9 | 3.3 | 3.7 | 4.1 | 4.6 |
| Account Receivables, % | 7.99 | 8.54 | 11.48 | 12.47 | 7.88 | 9.67 | 9.67 | 9.67 | 9.67 | 9.67 |
| Inventories | .0 | .0 | .0 | .0 | .0 | .0 | .0 | .0 | .0 | .0 |
| Inventories, % | 0 | 0 | 0 | 0 | 0 | 0 | 0 | 0 | 0 | 0 |
| Accounts Payable | .0 | .0 | .0 | .0 | .0 | .0 | .0 | .0 | .0 | .0 |
| Accounts Payable, % | 0 | 0 | 0 | 0 | 0 | 0 | 0 | 0 | 0 | 0 |
| Capital Expenditure | -.3 | .0 | -.1 | -.3 | -.4 | -.4 | -.4 | -.4 | -.5 | -.6 |
| Capital Expenditure, % | -1.79 | -0.20515 | -0.59489 | -1.9 | -1.38 | -1.17 | -1.17 | -1.17 | -1.17 | -1.17 |
| Tax Rate, % | 3764.29 | 3764.29 | 3764.29 | 3764.29 | 3764.29 | 3764.29 | 3764.29 | 3764.29 | 3764.29 | 3764.29 |
| EBITAT | 1.1 | 2.6 | -.6 | -10.7 | -.5 | -.7 | -.8 | -.9 | -1.0 | -1.2 |
| Depreciation | ||||||||||
| Changes in Account Receivables | ||||||||||
| Changes in Inventories | ||||||||||
| Changes in Accounts Payable | ||||||||||
| Capital Expenditure | ||||||||||
| UFCF | -.1 | 3.1 | -.6 | -10.8 | -.3 | -1.1 | -.7 | -.7 | -.8 | -.9 |
| WACC, % | 15.45 | 12.98 | 9.58 | 15.45 | 2.22 | 11.14 | 11.14 | 11.14 | 11.14 | 11.14 |
| PV UFCF | ||||||||||
| SUM PV UFCF | -3.1 | |||||||||
| Long Term Growth Rate, % | 2.00 | |||||||||
| Free cash flow (T + 1) | -1 | |||||||||
| Terminal Value | -10 | |||||||||
| Present Terminal Value | -6 | |||||||||
| Enterprise Value | -9 | |||||||||
| Net Debt | 45 | |||||||||
| Equity Value | -54 | |||||||||
| Diluted Shares Outstanding, MM | 4 | |||||||||
| Equity Value Per Share | -12.55 |
What You Will Get
- Editable Excel Template: A fully customizable Excel-based DCF Calculator featuring pre-filled real FSEA financials.
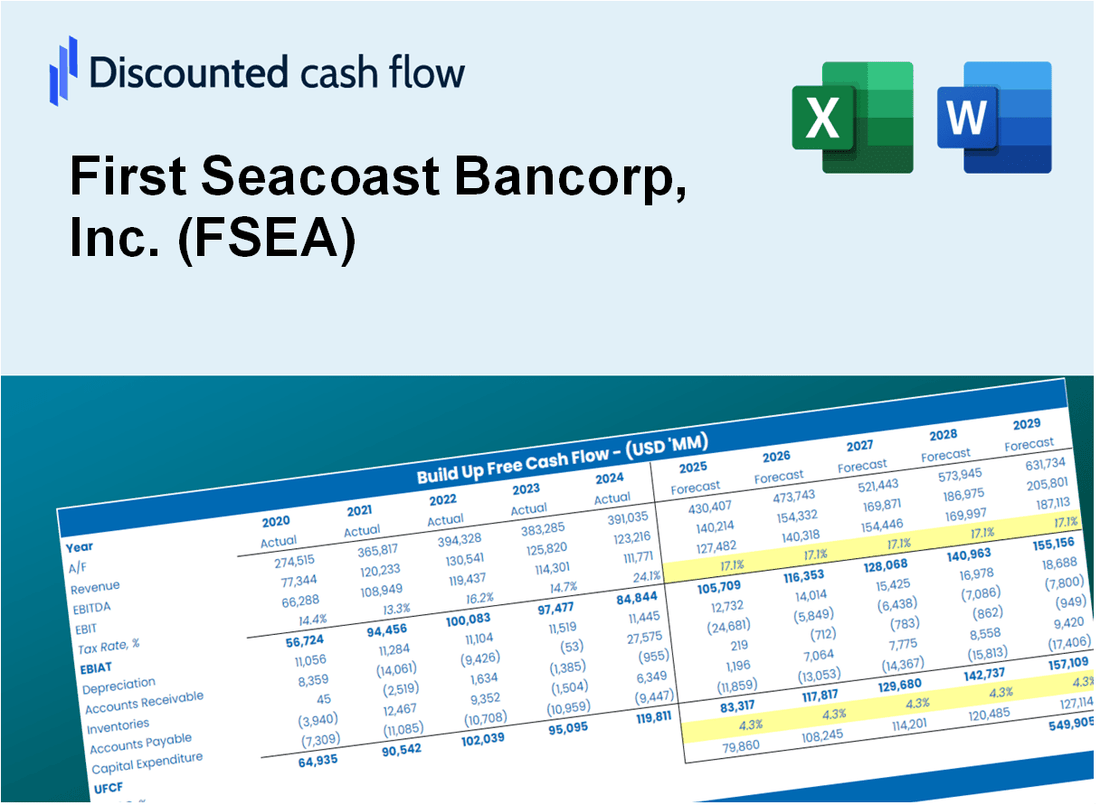
- Real-World Data: Historical data and forward-looking estimates (highlighted in the yellow cells).
- Forecast Flexibility: Adjust forecast assumptions such as revenue growth, EBITDA %, and WACC.
- Automatic Calculations: Instantly observe how your inputs affect First Seacoast Bancorp's valuation.
- Professional Tool: Designed for investors, CFOs, consultants, and financial analysts.
- User-Friendly Design: Organized for clarity and ease of use, complete with step-by-step instructions.
Key Features
- Customizable Financial Inputs: Adjust essential parameters such as loan growth, interest rates, and operating expenses.
- Instant DCF Valuation: Quickly computes intrinsic value, NPV, and other key financial metrics.
- Industry-Leading Precision: Leverages First Seacoast Bancorp’s (FSEA) actual financial data for accurate valuation results.
- Simplified Scenario Planning: Easily evaluate various assumptions and analyze different financial outcomes.
- Efficiency Booster: Remove the hassle of developing intricate valuation models from the ground up.
How It Works
- Step 1: Download the Excel file for First Seacoast Bancorp, Inc. (FSEA).
- Step 2: Review the pre-filled financial data and forecasts specific to (FSEA).
- Step 3: Adjust key inputs such as revenue growth, WACC, and tax rates (highlighted cells).
- Step 4: Observe the DCF model update in real-time as you adjust your assumptions.
- Step 5: Evaluate the outputs and leverage the results for informed investment decisions regarding (FSEA).
Why Choose This Calculator for First Seacoast Bancorp, Inc. (FSEA)?
- User-Friendly Interface: Perfectly tailored for both novice and seasoned users.
- Customizable Inputs: Easily adjust parameters to fit your financial analysis.
- Real-Time Feedback: Observe immediate updates to First Seacoast's valuation as you modify inputs.
- Pre-Loaded Data: Comes equipped with First Seacoast’s actual financial statistics for swift assessments.
- Relied Upon by Experts: Utilized by financial analysts and investors for making well-informed choices.
Who Should Use This Product?
- Finance Students: Explore financial modeling techniques and apply them with real-world data.
- Academics: Integrate advanced financial models into your curriculum or research projects.
- Investors: Validate your investment strategies and evaluate the financial performance of First Seacoast Bancorp, Inc. (FSEA).
- Analysts: Enhance your analysis with a customizable financial forecasting model tailored for banking institutions.
- Small Business Owners: Understand the financial metrics used to assess larger banking entities like First Seacoast Bancorp, Inc. (FSEA).
What the Template Contains
- Operating and Balance Sheet Data: Pre-filled First Seacoast Bancorp, Inc. (FSEA) historical data and forecasts, including revenue, EBITDA, EBIT, and capital expenditures.
- WACC Calculation: A dedicated sheet for Weighted Average Cost of Capital (WACC), featuring parameters such as Beta, risk-free rate, and share price.
- DCF Valuation (Unlevered and Levered): Editable Discounted Cash Flow models illustrating intrinsic value with comprehensive calculations.
- Financial Statements: Pre-loaded financial statements (annual and quarterly) to facilitate analysis.
- Key Ratios: Includes profitability, leverage, and efficiency ratios for First Seacoast Bancorp, Inc. (FSEA).
- Dashboard and Charts: Visual summary of valuation outputs and assumptions to simplify results analysis.
Disclaimer
All information, articles, and product details provided on this website are for general informational and educational purposes only. We do not claim any ownership over, nor do we intend to infringe upon, any trademarks, copyrights, logos, brand names, or other intellectual property mentioned or depicted on this site. Such intellectual property remains the property of its respective owners, and any references here are made solely for identification or informational purposes, without implying any affiliation, endorsement, or partnership.
We make no representations or warranties, express or implied, regarding the accuracy, completeness, or suitability of any content or products presented. Nothing on this website should be construed as legal, tax, investment, financial, medical, or other professional advice. In addition, no part of this site—including articles or product references—constitutes a solicitation, recommendation, endorsement, advertisement, or offer to buy or sell any securities, franchises, or other financial instruments, particularly in jurisdictions where such activity would be unlawful.
All content is of a general nature and may not address the specific circumstances of any individual or entity. It is not a substitute for professional advice or services. Any actions you take based on the information provided here are strictly at your own risk. You accept full responsibility for any decisions or outcomes arising from your use of this website and agree to release us from any liability in connection with your use of, or reliance upon, the content or products found herein.