
|
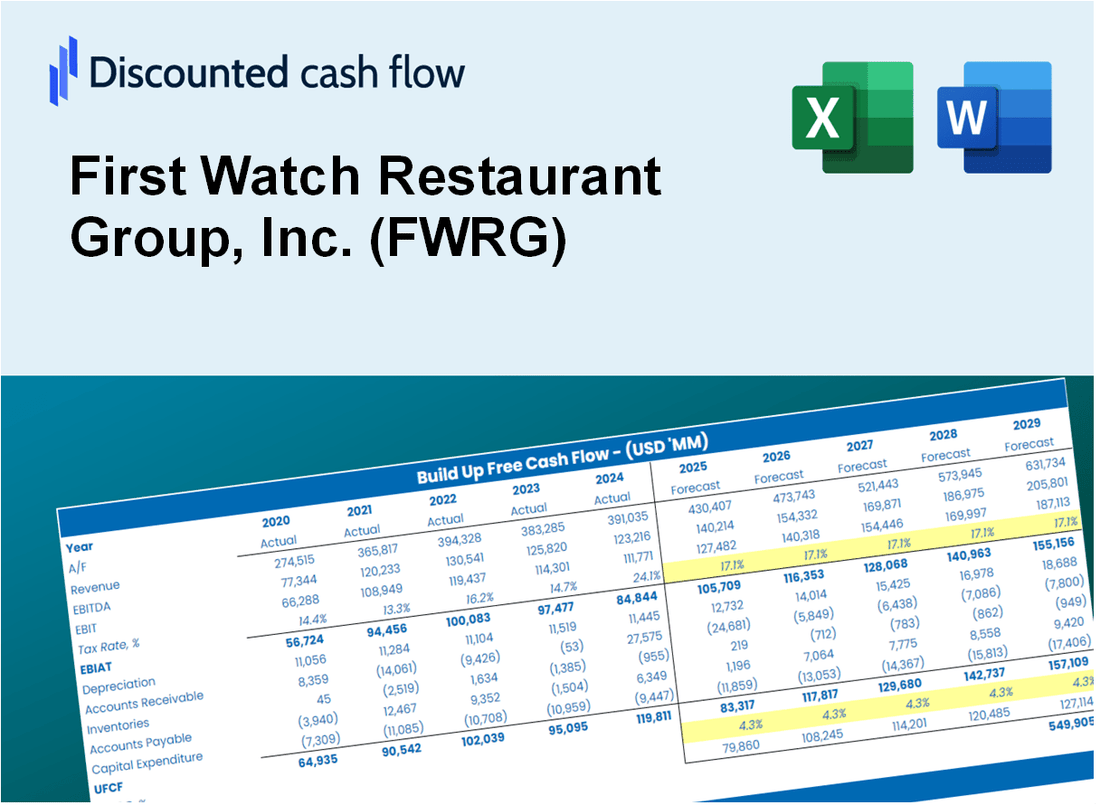
Valoración DCF de First Watch Restaurant Group, Inc. (FWRG) |
Completamente Editable: Adáptelo A Sus Necesidades En Excel O Sheets
Diseño Profesional: Plantillas Confiables Y Estándares De La Industria
Predeterminadas Para Un Uso Rápido Y Eficiente
Compatible con MAC / PC, completamente desbloqueado
No Se Necesita Experiencia; Fáciles De Seguir
First Watch Restaurant Group, Inc. (FWRG) Bundle
Valoración de Streamline First Watch Restaurant Group, Inc. (FWRG) ¡con nuestra calculadora DCF flexible! Utilizando las finanzas de primer reloj reales y las entradas de pronóstico modificables, puede explorar varios escenarios y determinar el valor razonable del primer reloj en solo minutos.
Discounted Cash Flow (DCF) - (USD MM)
| Year | AY1 2020 |
AY2 2021 |
AY3 2022 |
AY4 2023 |
AY5 2024 |
FY1 2025 |
FY2 2026 |
FY3 2027 |
FY4 2028 |
FY5 2029 |
|---|---|---|---|---|---|---|---|---|---|---|
| Revenue | 342.4 | 601.2 | 730.2 | 891.6 | 1,015.9 | 1,353.9 | 1,804.4 | 2,404.8 | 3,205.0 | 4,271.4 |
| Revenue Growth, % | 0 | 75.59 | 21.45 | 22.1 | 13.95 | 33.27 | 33.27 | 33.27 | 33.27 | 33.27 |
| EBITDA | -4.3 | 52.8 | 52.1 | 85.4 | 98.4 | 91.9 | 122.4 | 163.2 | 217.5 | 289.8 |
| EBITDA, % | -1.25 | 8.79 | 7.13 | 9.57 | 9.68 | 6.79 | 6.79 | 6.79 | 6.79 | 6.79 |
| Depreciation | 42.5 | 32.4 | 34.2 | 41.2 | 57.7 | 88.8 | 118.3 | 157.6 | 210.1 | 280.0 |
| Depreciation, % | 12.4 | 5.39 | 4.69 | 4.62 | 5.68 | 6.56 | 6.56 | 6.56 | 6.56 | 6.56 |
| EBIT | -46.7 | 20.5 | 17.8 | 44.1 | 40.7 | 3.1 | 4.1 | 5.5 | 7.4 | 9.8 |
| EBIT, % | -13.65 | 3.4 | 2.44 | 4.95 | 4 | 0.22968 | 0.22968 | 0.22968 | 0.22968 | 0.22968 |
| Total Cash | 38.8 | 51.9 | 49.7 | 49.6 | 33.3 | 96.5 | 128.6 | 171.3 | 228.3 | 304.3 |
| Total Cash, percent | .0 | .0 | .0 | .0 | .0 | .0 | .0 | .0 | .0 | .0 |
| Account Receivables | 3.9 | 4.5 | 6.2 | 5.5 | 7.2 | 11.0 | 14.7 | 19.5 | 26.0 | 34.7 |
| Account Receivables, % | 1.14 | 0.74019 | 0.8442 | 0.62049 | 0.71217 | 0.8121 | 0.8121 | 0.8121 | 0.8121 | 0.8121 |
| Inventories | 2.9 | 4.0 | 5.0 | 5.4 | 6.1 | 9.2 | 12.3 | 16.4 | 21.9 | 29.2 |
| Inventories, % | 0.85137 | 0.66917 | 0.68861 | 0.60355 | 0.60212 | 0.68297 | 0.68297 | 0.68297 | 0.68297 | 0.68297 |
| Accounts Payable | 4.2 | 11.1 | 7.6 | 6.3 | 7.0 | 14.9 | 19.9 | 26.5 | 35.3 | 47.0 |
| Accounts Payable, % | 1.23 | 1.84 | 1.04 | 0.70933 | 0.6852 | 1.1 | 1.1 | 1.1 | 1.1 | 1.1 |
| Capital Expenditure | -27.0 | -35.7 | -63.3 | -84.5 | -127.9 | -120.7 | -160.8 | -214.3 | -285.6 | -380.7 |
| Capital Expenditure, % | -7.88 | -5.94 | -8.67 | -9.48 | -12.59 | -8.91 | -8.91 | -8.91 | -8.91 | -8.91 |
| Tax Rate, % | 32.47 | 32.47 | 32.47 | 32.47 | 32.47 | 32.47 | 32.47 | 32.47 | 32.47 | 32.47 |
| EBITAT | -33.4 | -116.6 | 9.8 | 31.1 | 27.5 | 1.6 | 2.2 | 2.9 | 3.9 | 5.2 |
| Depreciation | ||||||||||
| Changes in Account Receivables | ||||||||||
| Changes in Inventories | ||||||||||
| Changes in Accounts Payable | ||||||||||
| Capital Expenditure | ||||||||||
| UFCF | -20.5 | -114.7 | -25.5 | -13.2 | -44.6 | -29.2 | -42.1 | -56.1 | -74.8 | -99.7 |
| WACC, % | 5.55 | 4.38 | 5.28 | 5.53 | 5.48 | 5.24 | 5.24 | 5.24 | 5.24 | 5.24 |
| PV UFCF | ||||||||||
| SUM PV UFCF | -252.1 | |||||||||
| Long Term Growth Rate, % | 2.00 | |||||||||
| Free cash flow (T + 1) | -102 | |||||||||
| Terminal Value | -3,134 | |||||||||
| Present Terminal Value | -2,427 | |||||||||
| Enterprise Value | -2,679 | |||||||||
| Net Debt | 776 | |||||||||
| Equity Value | -3,456 | |||||||||
| Diluted Shares Outstanding, MM | 62 | |||||||||
| Equity Value Per Share | -55.42 |
What You Will Get
- Real First Watch Data: Preloaded financials – from revenue to EBIT – based on actual and projected figures for First Watch Restaurant Group, Inc. (FWRG).
- Full Customization: Adjust all critical parameters (yellow cells) like WACC, growth %, and tax rates to fit your analysis.
- Instant Valuation Updates: Automatic recalculations to assess the impact of changes on First Watch's fair value.
- Versatile Excel Template: Designed for quick edits, scenario testing, and comprehensive projections specific to First Watch Restaurant Group, Inc. (FWRG).
- Time-Saving and Accurate: Avoid the hassle of building models from scratch while ensuring accuracy and flexibility.
Key Features
- Real-Life FWRG Data: Pre-filled with First Watch Restaurant Group's historical financials and future projections.
- Fully Customizable Inputs: Modify revenue growth, profit margins, WACC, tax rates, and capital expenditures.
- Dynamic Valuation Model: Automatic updates to Net Present Value (NPV) and intrinsic value based on your adjustments.
- Scenario Testing: Generate multiple forecasting scenarios to evaluate various valuation outcomes.
- User-Friendly Design: Intuitive, organized, and tailored for both professionals and newcomers.
How It Works
- Step 1: Download the Excel file.
- Step 2: Review pre-entered First Watch Restaurant Group, Inc. (FWRG) data (historical and projected).
- Step 3: Adjust key assumptions (yellow cells) based on your analysis.
- Step 4: View automatic recalculations for First Watch Restaurant Group, Inc. (FWRG) intrinsic value.
- Step 5: Use the outputs for investment decisions or reporting.
Why Choose This Calculator for First Watch Restaurant Group, Inc. (FWRG)?
- Designed for Industry Experts: A sophisticated tool tailored for restaurant analysts, financial officers, and industry consultants.
- Comprehensive Data: First Watch’s historical and projected financials preloaded for enhanced accuracy.
- Flexible Scenario Analysis: Effortlessly simulate various forecasts and assumptions.
- Insightful Outputs: Automatically calculates intrinsic value, net present value (NPV), and essential metrics.
- User-Friendly Interface: Step-by-step guidance ensures a smooth experience throughout the process.
Who Should Use This Product?
- Restaurant Management Students: Understand operational strategies and analyze performance metrics using real data.
- Academics: Integrate industry-specific models into your curriculum or research projects.
- Investors: Evaluate your investment hypotheses and assess financial outcomes for First Watch Restaurant Group, Inc. (FWRG).
- Market Analysts: Enhance your analysis with a customizable financial model tailored for the restaurant industry.
- Entrepreneurs: Discover how established companies like First Watch are evaluated and the factors influencing their success.
What the Template Contains
- Pre-Filled DCF Model: First Watch Restaurant Group’s (FWRG) financial data preloaded for immediate use.
- WACC Calculator: Detailed calculations for Weighted Average Cost of Capital tailored to (FWRG).
- Financial Ratios: Assess First Watch's (FWRG) profitability, leverage, and efficiency metrics.
- Editable Inputs: Modify assumptions such as growth, margins, and CAPEX to align with your scenarios.
- Financial Statements: Annual and quarterly reports for comprehensive analysis of (FWRG).
- Interactive Dashboard: Effortlessly visualize key valuation metrics and results for (FWRG).
Disclaimer
All information, articles, and product details provided on this website are for general informational and educational purposes only. We do not claim any ownership over, nor do we intend to infringe upon, any trademarks, copyrights, logos, brand names, or other intellectual property mentioned or depicted on this site. Such intellectual property remains the property of its respective owners, and any references here are made solely for identification or informational purposes, without implying any affiliation, endorsement, or partnership.
We make no representations or warranties, express or implied, regarding the accuracy, completeness, or suitability of any content or products presented. Nothing on this website should be construed as legal, tax, investment, financial, medical, or other professional advice. In addition, no part of this site—including articles or product references—constitutes a solicitation, recommendation, endorsement, advertisement, or offer to buy or sell any securities, franchises, or other financial instruments, particularly in jurisdictions where such activity would be unlawful.
All content is of a general nature and may not address the specific circumstances of any individual or entity. It is not a substitute for professional advice or services. Any actions you take based on the information provided here are strictly at your own risk. You accept full responsibility for any decisions or outcomes arising from your use of this website and agree to release us from any liability in connection with your use of, or reliance upon, the content or products found herein.