
|
Valoración DCF de Greenlane Holdings, Inc. (GNLN) |
Completamente Editable: Adáptelo A Sus Necesidades En Excel O Sheets
Diseño Profesional: Plantillas Confiables Y Estándares De La Industria
Predeterminadas Para Un Uso Rápido Y Eficiente
Compatible con MAC / PC, completamente desbloqueado
No Se Necesita Experiencia; Fáciles De Seguir
Greenlane Holdings, Inc. (GNLN) Bundle
¡Descubra el potencial financiero de Greenlane Holdings, Inc. (GNLN) con nuestra calculadora DCF fácil de usar! Ingrese sus proyecciones para el crecimiento, los márgenes y los costos para calcular el valor intrínseco de Greenlane Holdings, Inc. (GNLN) y mejorar su enfoque de inversión.
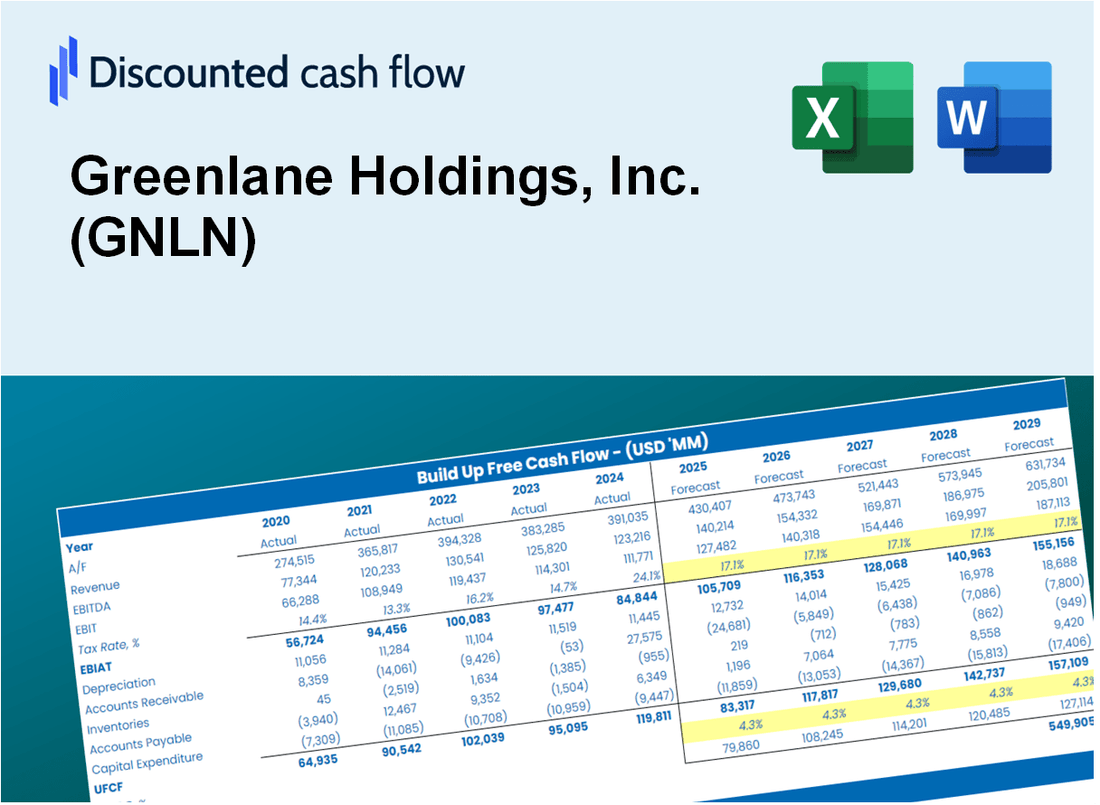
Discounted Cash Flow (DCF) - (USD MM)
| Year | AY1 2020 |
AY2 2021 |
AY3 2022 |
AY4 2023 |
AY5 2024 |
FY1 2025 |
FY2 2026 |
FY3 2027 |
FY4 2028 |
FY5 2029 |
|---|---|---|---|---|---|---|---|---|---|---|
| Revenue | 138.3 | 166.1 | 137.1 | 65.4 | 13.3 | 9.0 | 6.1 | 4.1 | 2.8 | 1.9 |
| Revenue Growth, % | 0 | 20.07 | -17.45 | -52.31 | -79.69 | -32.35 | -32.35 | -32.35 | -32.35 | -32.35 |
| EBITDA | -44.6 | -48.2 | -172.4 | -24.6 | -10.9 | -5.0 | -3.4 | -2.3 | -1.6 | -1.1 |
| EBITDA, % | -32.21 | -29 | -125.75 | -37.68 | -82.23 | -56.22 | -56.22 | -56.22 | -56.22 | -56.22 |
| Depreciation | 2.5 | 4.7 | 7.4 | 2.2 | .8 | .4 | .2 | .2 | .1 | .1 |
| Depreciation, % | 1.82 | 2.82 | 5.4 | 3.43 | 6.03 | 3.9 | 3.9 | 3.9 | 3.9 | 3.9 |
| EBIT | -47.1 | -52.8 | -179.8 | -26.9 | -11.7 | -5.3 | -3.6 | -2.4 | -1.6 | -1.1 |
| EBIT, % | -34.04 | -31.82 | -131.15 | -41.11 | -88.26 | -59.04 | -59.04 | -59.04 | -59.04 | -59.04 |
| Total Cash | 30.4 | 12.9 | 6.5 | .5 | .9 | .8 | .5 | .3 | .2 | .2 |
| Total Cash, percent | .0 | .0 | .0 | .0 | .0 | .0 | .0 | .0 | .0 | .0 |
| Account Receivables | 6.3 | 19.5 | 6.5 | 3.0 | 4.3 | 1.0 | .7 | .5 | .3 | .2 |
| Account Receivables, % | 4.58 | 11.75 | 4.72 | 4.6 | 32.11 | 11.55 | 11.55 | 11.55 | 11.55 | 11.55 |
| Inventories | 36.1 | 67.0 | 40.6 | 20.5 | 14.2 | 4.1 | 2.8 | 1.9 | 1.3 | .9 |
| Inventories, % | 26.08 | 40.34 | 29.65 | 31.4 | 107.08 | 45.49 | 45.49 | 45.49 | 45.49 | 45.49 |
| Accounts Payable | 18.4 | 23.0 | 15.0 | 12.1 | 9.8 | 2.3 | 1.6 | 1.1 | .7 | .5 |
| Accounts Payable, % | 13.31 | 13.88 | 10.91 | 18.51 | 73.73 | 26.07 | 26.07 | 26.07 | 26.07 | 26.07 |
| Capital Expenditure | -2.3 | -4.7 | -2.8 | -1.0 | -.2 | -.2 | -.1 | -.1 | -.1 | .0 |
| Capital Expenditure, % | -1.67 | -2.84 | -2.03 | -1.54 | -1.84 | -1.98 | -1.98 | -1.98 | -1.98 | -1.98 |
| Tax Rate, % | 0.0962791 | 0.0962791 | 0.0962791 | 0.0962791 | 0.0962791 | 0.0962791 | 0.0962791 | 0.0962791 | 0.0962791 | 0.0962791 |
| EBITAT | -14.4 | -30.3 | -167.2 | -26.7 | -11.7 | -4.0 | -2.7 | -1.8 | -1.2 | -.8 |
| Depreciation | ||||||||||
| Changes in Account Receivables | ||||||||||
| Changes in Inventories | ||||||||||
| Changes in Accounts Payable | ||||||||||
| Capital Expenditure | ||||||||||
| UFCF | -38.2 | -69.7 | -131.3 | -4.8 | -8.4 | 2.0 | -1.7 | -1.2 | -.8 | -.5 |
| WACC, % | 20.9 | 39.16 | 63.61 | 68.07 | 68.32 | 52.01 | 52.01 | 52.01 | 52.01 | 52.01 |
| PV UFCF | ||||||||||
| SUM PV UFCF | .1 | |||||||||
| Long Term Growth Rate, % | 2.00 | |||||||||
| Free cash flow (T + 1) | -1 | |||||||||
| Terminal Value | -1 | |||||||||
| Present Terminal Value | 0 | |||||||||
| Enterprise Value | 0 | |||||||||
| Net Debt | 8 | |||||||||
| Equity Value | -8 | |||||||||
| Diluted Shares Outstanding, MM | 0 | |||||||||
| Equity Value Per Share | -4,862.61 |
What You Will Receive
- Adjustable Forecast Inputs: Effortlessly modify assumptions (growth %, margins, WACC) to explore various scenarios.
- Comprehensive Data: Greenlane Holdings, Inc.'s (GNLN) financial information pre-loaded to enhance your analysis.
- Instant DCF Outputs: The template automatically computes Net Present Value (NPV) and intrinsic value for your convenience.
- Customizable and Professional Design: A refined Excel model tailored to meet your valuation requirements.
- Designed for Analysts and Investors: Perfect for evaluating projections, confirming strategies, and optimizing time efficiency.
Key Features
- Comprehensive DCF Calculator: Features robust unlevered and levered DCF valuation frameworks tailored for Greenlane Holdings, Inc. (GNLN).
- WACC Estimator: Pre-configured Weighted Average Cost of Capital sheet with adjustable parameters for precise calculations.
- Customizable Forecast Inputs: Easily alter growth projections, capital expenditures, and discount rates to fit your analysis.
- Integrated Financial Ratios: Evaluate profitability, leverage, and efficiency metrics specifically for Greenlane Holdings, Inc. (GNLN).
- Interactive Dashboard and Visuals: Graphical representations of key valuation indicators for straightforward interpretation.
How It Works
- 1. Access the Template: Download and open the Excel file containing Greenlane Holdings, Inc.'s preloaded data.
- 2. Modify Assumptions: Adjust essential inputs such as growth rates, WACC, and capital expenditures.
- 3. Analyze Results Instantly: The DCF model automatically computes intrinsic value and NPV.
- 4. Explore Scenarios: Evaluate various forecasts to assess different valuation outcomes.
- 5. Present with Assurance: Deliver professional valuation insights to inform your strategic decisions.
Why Choose This Calculator for Greenlane Holdings, Inc. (GNLN)?
- Accurate Data: Real Greenlane financials ensure reliable valuation results.
- Customizable: Adjust key parameters like growth rates, WACC, and tax rates to align with your projections.
- Time-Saving: Pre-built calculations remove the hassle of starting from scratch.
- Professional-Grade Tool: Tailored for investors, analysts, and consultants in the cannabis industry.
- User-Friendly: Intuitive design and step-by-step guidance make it accessible for all users.
Who Should Use This Product?
- Finance Students: Explore sustainable investment strategies and apply them using real-time data.
- Academics: Integrate environmental, social, and governance (ESG) models into your research or curriculum.
- Investors: Evaluate your investment hypotheses and analyze valuation results for Greenlane Holdings, Inc. (GNLN).
- Analysts: Enhance your analysis with a tailored, user-friendly DCF model focused on green industries.
- Small Business Owners: Understand how public companies like Greenlane Holdings, Inc. (GNLN) are evaluated in the market.
What the Template Contains
- Historical Data: Includes Greenlane Holdings' past financials and baseline forecasts.
- DCF and Levered DCF Models: Detailed templates to calculate Greenlane Holdings' intrinsic value.
- WACC Sheet: Pre-built calculations for Weighted Average Cost of Capital.
- Editable Inputs: Modify key drivers like growth rates, EBITDA %, and CAPEX assumptions.
- Quarterly and Annual Statements: A complete breakdown of Greenlane Holdings' financials.
- Interactive Dashboard: Visualize valuation results and projections dynamically.
Disclaimer
All information, articles, and product details provided on this website are for general informational and educational purposes only. We do not claim any ownership over, nor do we intend to infringe upon, any trademarks, copyrights, logos, brand names, or other intellectual property mentioned or depicted on this site. Such intellectual property remains the property of its respective owners, and any references here are made solely for identification or informational purposes, without implying any affiliation, endorsement, or partnership.
We make no representations or warranties, express or implied, regarding the accuracy, completeness, or suitability of any content or products presented. Nothing on this website should be construed as legal, tax, investment, financial, medical, or other professional advice. In addition, no part of this site—including articles or product references—constitutes a solicitation, recommendation, endorsement, advertisement, or offer to buy or sell any securities, franchises, or other financial instruments, particularly in jurisdictions where such activity would be unlawful.
All content is of a general nature and may not address the specific circumstances of any individual or entity. It is not a substitute for professional advice or services. Any actions you take based on the information provided here are strictly at your own risk. You accept full responsibility for any decisions or outcomes arising from your use of this website and agree to release us from any liability in connection with your use of, or reliance upon, the content or products found herein.