
|
Hindustan Petroleum Corporation Limited (HindPetro.ns) Valoración de DCF |
Completamente Editable: Adáptelo A Sus Necesidades En Excel O Sheets
Diseño Profesional: Plantillas Confiables Y Estándares De La Industria
Predeterminadas Para Un Uso Rápido Y Eficiente
Compatible con MAC / PC, completamente desbloqueado
No Se Necesita Experiencia; Fáciles De Seguir
Hindustan Petroleum Corporation Limited (HINDPETRO.NS) Bundle
¡Obtenga información sobre su análisis de valoración de Hindustan Petroleum Corporation Limited (Hindpetrons) con nuestra sofisticada calculadora DCF! Cargados con datos actualizados para (Hindpetrons), esta plantilla de Excel le permite ajustar los pronósticos y los supuestos, lo que le permite calcular el valor intrínseco de Hindustan Petroleum Corporation Limited (hindfontones) con precisión.
Benefits of Choosing Hindustan Petroleum Corporation Limited (HINDPETRONS)
- Comprehensive Financial Model: Access to Hindustan Petroleum's actual data for accurate DCF valuation.
- Complete Forecasting Control: Modify revenue growth, profit margins, WACC, and other key metrics to suit your analysis.
- Real-Time Calculations: Automatic updates allow you to see the impact of your adjustments immediately.
- Professional-Grade Template: A polished Excel file crafted for high-quality valuation needs.
- Flexible and Reusable: Designed for adaptability, making it easy to conduct detailed forecasts repeatedly.
Key Features
- 🔍 Real-Life HINDPETRONS Financials: Pre-filled historical and projected data for Hindustan Petroleum Corporation Limited.
- ✏️ Fully Customizable Inputs: Modify all essential parameters (yellow cells) like WACC, growth %, and tax rates.
- 📊 Professional DCF Valuation: Integrated formulas compute Hindustan Petroleum’s intrinsic value using the Discounted Cash Flow method.
- ⚡ Instant Results: Visualize Hindustan Petroleum’s valuation immediately after adjustments.
- Scenario Analysis: Evaluate and compare outcomes for different financial assumptions side-by-side.
How It Works
- Step 1: Download the Excel file.
- Step 2: Examine the pre-filled data for Hindustan Petroleum Corporation Limited (HINDPETRONS) (HINDPETRONS) including both historical and projected figures.
- Step 3: Modify the key assumptions (highlighted in yellow) according to your analysis.
- Step 4: Observe the automatic recalculations of Hindustan Petroleum Corporation Limited (HINDPETRONS)'s intrinsic value.
- Step 5: Utilize the results for making investment choices or for reporting purposes.
Why Select This Calculator for Hindustan Petroleum Corporation Limited (HINDPETRONS)?
- Reliable Data: Access real financial figures from Hindustan Petroleum to ensure accurate valuation results.
- Customizable Options: Modify essential parameters such as growth rates, WACC, and tax rates to align with your forecasts.
- Efficiency Boost: Built-in calculations save you time by removing the need to start with a blank slate.
- Professional-Quality Tool: Tailored for investors, analysts, and consultants in the energy sector.
- User-Friendly Design: Clear layout and guided steps make it accessible to all users.
Who Can Benefit from HINDPETRONS?
- Finance Students: Master financial analysis techniques and apply them to real-world data.
- Academics: Integrate industry-standard models into your teaching or research projects.
- Investors: Validate your investment hypotheses and evaluate valuation metrics for Hindustan Petroleum (HINDPETRONS).
- Analysts: Enhance your efficiency with a ready-to-use, customizable DCF model.
- Small Business Owners: Understand the analytical approaches used for large corporations like Hindustan Petroleum.
Overview of Template Components
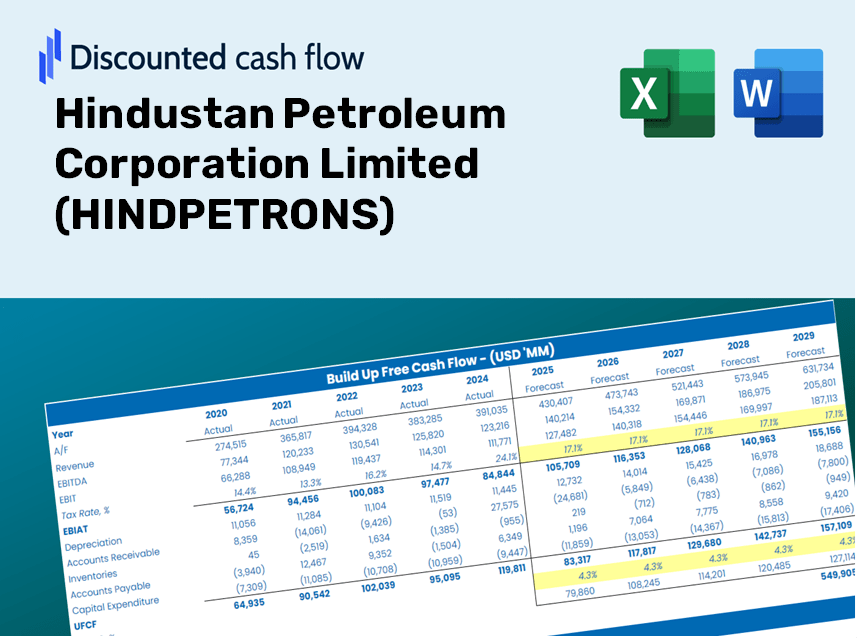
- Operating and Balance Sheet Data: Pre-filled historical data and forecasts for Hindustan Petroleum Corporation Limited (HINDPETRONS), including revenue, EBITDA, EBIT, and capital expenditures.
- WACC Calculation: A dedicated sheet for calculating the Weighted Average Cost of Capital (WACC), featuring parameters such as Beta, risk-free rate, and share price.
- DCF Valuation (Unlevered and Levered): Customizable Discounted Cash Flow models that display intrinsic value along with comprehensive calculations.
- Financial Statements: Pre-loaded annual and quarterly financial statements to assist in analysis.
- Key Ratios: A collection of profitability, leverage, and efficiency ratios specific to Hindustan Petroleum Corporation Limited (HINDPETRONS).
- Dashboard and Charts: A visual summary of valuation outputs and assumptions for straightforward analysis of results.
Disclaimer
All information, articles, and product details provided on this website are for general informational and educational purposes only. We do not claim any ownership over, nor do we intend to infringe upon, any trademarks, copyrights, logos, brand names, or other intellectual property mentioned or depicted on this site. Such intellectual property remains the property of its respective owners, and any references here are made solely for identification or informational purposes, without implying any affiliation, endorsement, or partnership.
We make no representations or warranties, express or implied, regarding the accuracy, completeness, or suitability of any content or products presented. Nothing on this website should be construed as legal, tax, investment, financial, medical, or other professional advice. In addition, no part of this site—including articles or product references—constitutes a solicitation, recommendation, endorsement, advertisement, or offer to buy or sell any securities, franchises, or other financial instruments, particularly in jurisdictions where such activity would be unlawful.
All content is of a general nature and may not address the specific circumstances of any individual or entity. It is not a substitute for professional advice or services. Any actions you take based on the information provided here are strictly at your own risk. You accept full responsibility for any decisions or outcomes arising from your use of this website and agree to release us from any liability in connection with your use of, or reliance upon, the content or products found herein.