
|
Valoración de DCF de Hammerson PLC (HMSO.L) |
Completamente Editable: Adáptelo A Sus Necesidades En Excel O Sheets
Diseño Profesional: Plantillas Confiables Y Estándares De La Industria
Predeterminadas Para Un Uso Rápido Y Eficiente
Compatible con MAC / PC, completamente desbloqueado
No Se Necesita Experiencia; Fáciles De Seguir
Hammerson plc (HMSO.L) Bundle
¿Busca evaluar el valor intrínseco de Hammerson PLC? Nuestra calculadora HMSOL DCF integra datos del mundo real con una gama de características de personalización, lo que le permite refinar sus pronósticos y mejorar sus opciones de inversión.
What You Will Receive
- Authentic HMSOL Financial Data: Pre-populated with Hammerson plc’s historical and forecasted data for accurate analysis.
- Completely Customizable Template: Easily adjust key inputs such as revenue growth, WACC, and EBITDA margin.
- Instant Calculations: Observe real-time updates of Hammerson plc’s intrinsic value as you make modifications.
- Professional Valuation Tool: Tailored for investors, analysts, and consultants aiming for precise DCF outcomes.
- Intuitive Design: Streamlined layout and straightforward guidance suitable for all skill levels.
Key Features
- Real-Life HMSOL Data: Pre-filled with Hammerson plc’s historical financials and projections for future performance.
- Fully Customizable Inputs: Modify revenue growth, profit margins, WACC, tax rates, and capital expenditures as needed.
- Dynamic Valuation Model: Automatic recalculations of Net Present Value (NPV) and intrinsic value based on your customized inputs.
- Scenario Testing: Develop various forecasting scenarios to explore different valuation possibilities.
- User-Friendly Design: Streamlined and intuitive, catering to both professionals and newcomers.
How It Functions
- Step 1: Download the Excel spreadsheet.
- Step 2: Examine the pre-filled Hammerson plc (HMSOL) data (both historical and forecasted).
- Step 3: Modify key assumptions (highlighted in yellow) according to your findings.
- Step 4: Observe the automatic recalculations of Hammerson plc's (HMSOL) intrinsic value.
- Step 5: Utilize the results for investment strategies or reporting purposes.
Why Select This Calculator for Hammerson plc (HMSOL)?
- All-in-One Solution: Features DCF, WACC, and financial ratio assessments in a single tool.
- Flexible Inputs: Modify the yellow-highlighted cells to explore different scenarios.
- In-depth Analysis: Automatically computes Hammerson's intrinsic value and Net Present Value.
- Preloaded Information: Historical and projected data provide solid foundations for analysis.
- Expert-Level Quality: Perfectly suited for financial analysts, investors, and business consultants.
Who Can Benefit from Hammerson plc (HMSOL)?
- Investors: Make informed choices with a high-quality valuation tool tailored for real estate.
- Financial Analysts: Streamline your analysis with a customizable DCF model designed for property evaluations.
- Consultants: Effortlessly modify the template for client presentations or investment reports.
- Real Estate Enthusiasts: Enhance your knowledge of valuation methods through practical, industry-specific examples.
- Educators and Students: Utilize this resource as a hands-on aid in finance and real estate courses.
Contents of the Template
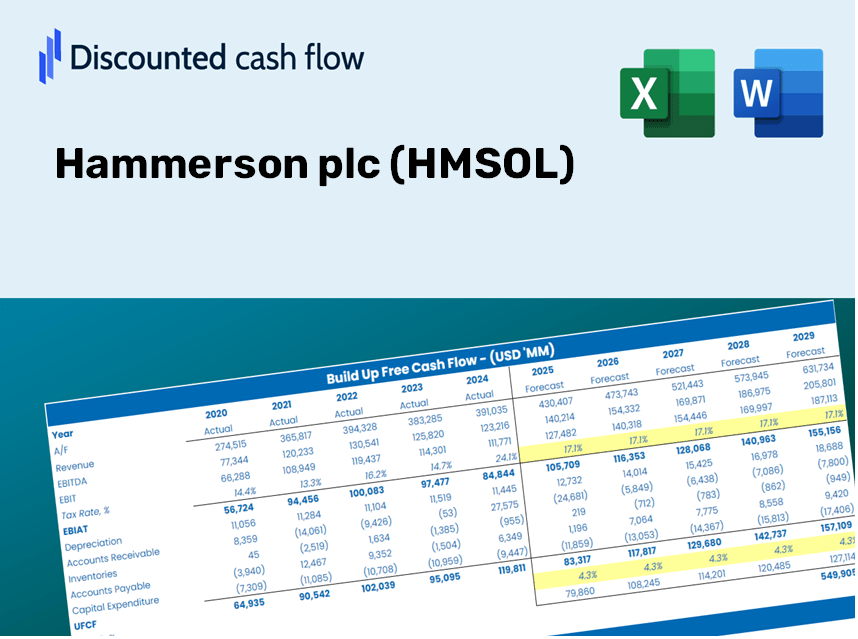
- Preloaded HMSOL Data: Historical and estimated financial figures, encompassing revenue, EBIT, and capital expenditures.
- DCF and WACC Models: Advanced spreadsheets for determining intrinsic value and Weighted Average Cost of Capital.
- Editable Inputs: Yellow-highlighted cells available for modifying revenue growth, tax rates, and discount rates.
- Financial Statements: Detailed annual and quarterly financials for in-depth analysis.
- Key Ratios: Ratios on profitability, leverage, and efficiency to assess company performance.
- Dashboard and Charts: Visual representations of valuation results and underlying assumptions.
Disclaimer
All information, articles, and product details provided on this website are for general informational and educational purposes only. We do not claim any ownership over, nor do we intend to infringe upon, any trademarks, copyrights, logos, brand names, or other intellectual property mentioned or depicted on this site. Such intellectual property remains the property of its respective owners, and any references here are made solely for identification or informational purposes, without implying any affiliation, endorsement, or partnership.
We make no representations or warranties, express or implied, regarding the accuracy, completeness, or suitability of any content or products presented. Nothing on this website should be construed as legal, tax, investment, financial, medical, or other professional advice. In addition, no part of this site—including articles or product references—constitutes a solicitation, recommendation, endorsement, advertisement, or offer to buy or sell any securities, franchises, or other financial instruments, particularly in jurisdictions where such activity would be unlawful.
All content is of a general nature and may not address the specific circumstances of any individual or entity. It is not a substitute for professional advice or services. Any actions you take based on the information provided here are strictly at your own risk. You accept full responsibility for any decisions or outcomes arising from your use of this website and agree to release us from any liability in connection with your use of, or reliance upon, the content or products found herein.