
|
Heidrick & Struggles International, Inc. (HSII) Valoración DCF |
Completamente Editable: Adáptelo A Sus Necesidades En Excel O Sheets
Diseño Profesional: Plantillas Confiables Y Estándares De La Industria
Predeterminadas Para Un Uso Rápido Y Eficiente
Compatible con MAC / PC, completamente desbloqueado
No Se Necesita Experiencia; Fáciles De Seguir
Heidrick & Struggles International, Inc. (HSII) Bundle
Descubre el verdadero valor de Heidrick & ¡Struggles International, Inc. (HSII) con nuestra calculadora DCF de grado profesional! Ajuste los supuestos clave, explore varios escenarios y evalúe cómo afectan los cambios a Heidrick & Valoración de Struggles International, Inc. (HSII): todo dentro de una sola plantilla de Excel.
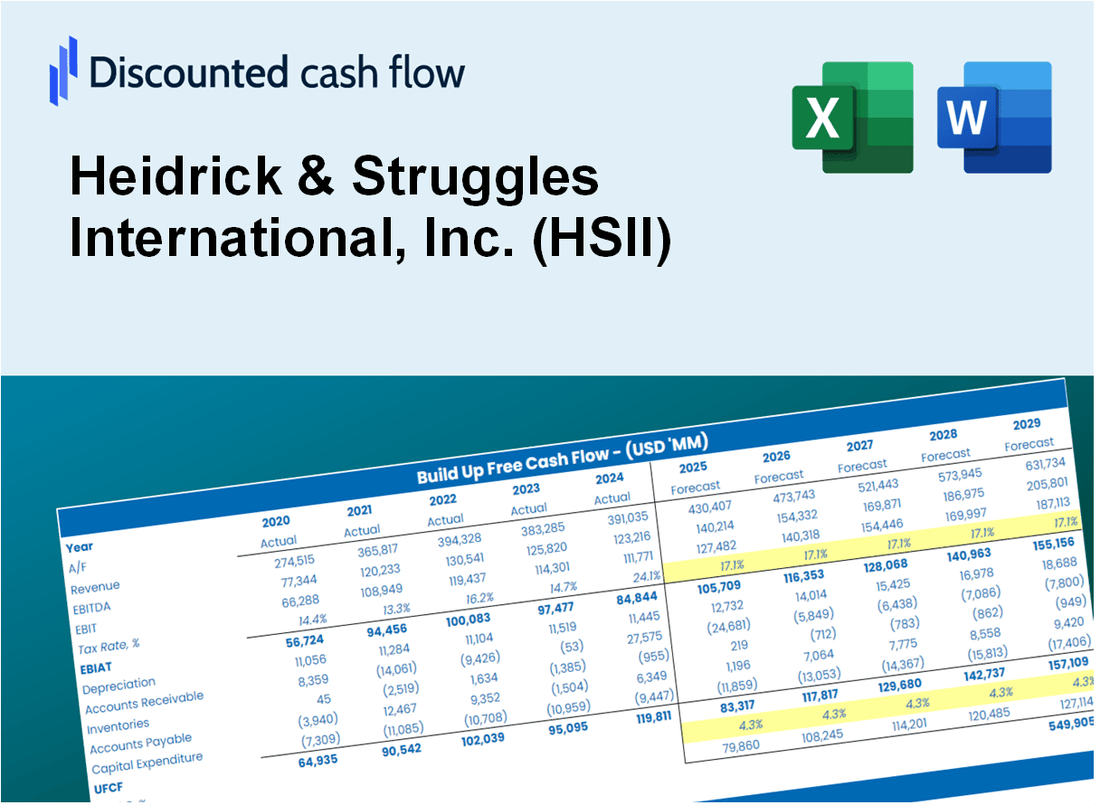
Discounted Cash Flow (DCF) - (USD MM)
| Year | AY1 2020 |
AY2 2021 |
AY3 2022 |
AY4 2023 |
AY5 2024 |
FY1 2025 |
FY2 2026 |
FY3 2027 |
FY4 2028 |
FY5 2029 |
|---|---|---|---|---|---|---|---|---|---|---|
| Revenue | 629.4 | 1,008.5 | 1,083.6 | 1,041.2 | 1,115.7 | 1,159.1 | 1,204.1 | 1,250.9 | 1,299.6 | 1,350.1 |
| Revenue Growth, % | 0 | 60.24 | 7.45 | -3.91 | 7.15 | 3.89 | 3.89 | 3.89 | 3.89 | 3.89 |
| EBITDA | 76.5 | 125.6 | 122.9 | 101.1 | 92.8 | 125.1 | 130.0 | 135.0 | 140.3 | 145.7 |
| EBITDA, % | 12.15 | 12.45 | 11.34 | 9.71 | 8.32 | 10.79 | 10.79 | 10.79 | 10.79 | 10.79 |
| Depreciation | 26.7 | 19.6 | 10.6 | 18.5 | 18.9 | 24.6 | 25.6 | 26.6 | 27.6 | 28.7 |
| Depreciation, % | 4.24 | 1.94 | 0.97851 | 1.78 | 1.69 | 2.12 | 2.12 | 2.12 | 2.12 | 2.12 |
| EBIT | 49.8 | 106.0 | 112.3 | 82.6 | 73.9 | 100.5 | 104.4 | 108.5 | 112.7 | 117.1 |
| EBIT, % | 7.91 | 10.51 | 10.36 | 7.93 | 6.63 | 8.67 | 8.67 | 8.67 | 8.67 | 8.67 |
| Total Cash | 336.5 | 545.2 | 621.6 | 478.2 | 563.5 | 605.8 | 629.3 | 653.8 | 679.2 | 705.6 |
| Total Cash, percent | .0 | .0 | .0 | .0 | .0 | .0 | .0 | .0 | .0 | .0 |
| Account Receivables | 113.6 | 173.9 | 172.7 | 175.6 | 140.8 | 187.1 | 194.4 | 202.0 | 209.8 | 218.0 |
| Account Receivables, % | 18.05 | 17.24 | 15.94 | 16.87 | 12.62 | 16.14 | 16.14 | 16.14 | 16.14 | 16.14 |
| Inventories | 19.0 | 21.8 | 24.1 | .0 | .0 | 17.1 | 17.8 | 18.5 | 19.2 | 20.0 |
| Inventories, % | 3.01 | 2.16 | 2.22 | 0 | 0 | 1.48 | 1.48 | 1.48 | 1.48 | 1.48 |
| Accounts Payable | 8.8 | 20.4 | 14.6 | 20.8 | 25.1 | 20.9 | 21.7 | 22.6 | 23.4 | 24.3 |
| Accounts Payable, % | 1.4 | 2.02 | 1.35 | 2 | 2.25 | 1.8 | 1.8 | 1.8 | 1.8 | 1.8 |
| Capital Expenditure | -7.3 | -6.2 | -11.1 | -13.4 | -26.3 | -15.0 | -15.6 | -16.2 | -16.8 | -17.4 |
| Capital Expenditure, % | -1.16 | -0.61876 | -1.03 | -1.29 | -2.36 | -1.29 | -1.29 | -1.29 | -1.29 | -1.29 |
| Tax Rate, % | 71.53 | 71.53 | 71.53 | 71.53 | 71.53 | 71.53 | 71.53 | 71.53 | 71.53 | 71.53 |
| EBITAT | 59.8 | 72.6 | 77.4 | 50.7 | 21.1 | 65.8 | 68.3 | 71.0 | 73.7 | 76.6 |
| Depreciation | ||||||||||
| Changes in Account Receivables | ||||||||||
| Changes in Inventories | ||||||||||
| Changes in Accounts Payable | ||||||||||
| Capital Expenditure | ||||||||||
| UFCF | -44.6 | 34.4 | 70.0 | 83.1 | 52.7 | 7.8 | 71.2 | 74.0 | 76.9 | 79.9 |
| WACC, % | 8.04 | 7.96 | 7.96 | 7.94 | 7.85 | 7.95 | 7.95 | 7.95 | 7.95 | 7.95 |
| PV UFCF | ||||||||||
| SUM PV UFCF | 238.3 | |||||||||
| Long Term Growth Rate, % | 0.50 | |||||||||
| Free cash flow (T + 1) | 80 | |||||||||
| Terminal Value | 1,078 | |||||||||
| Present Terminal Value | 735 | |||||||||
| Enterprise Value | 974 | |||||||||
| Net Debt | -415 | |||||||||
| Equity Value | 1,388 | |||||||||
| Diluted Shares Outstanding, MM | 21 | |||||||||
| Equity Value Per Share | 65.53 |
What You Will Receive
- Customizable Excel Template: A fully adaptable Excel-based DCF Calculator featuring pre-filled financial data for Heidrick & Struggles International, Inc. (HSII).
- Comprehensive Data: Access to historical figures and forward-looking projections (as indicated in the highlighted cells).
- Assumption Flexibility: Modify forecast inputs such as revenue growth, EBITDA margin, and WACC.
- Instant Calculations: Quickly observe how your adjustments affect Heidrick & Struggles' valuation.
- Professional Resource: Designed for investors, CFOs, consultants, and financial analysts.
- Intuitive Layout: Organized for simplicity and efficiency, complete with easy-to-follow instructions.
Key Features
- 🔍 Real-Life HSII Financials: Pre-filled historical and projected data for Heidrick & Struggles International, Inc. (HSII).
- ✏️ Fully Customizable Inputs: Adjust all critical parameters (yellow cells) like WACC, growth %, and tax rates.
- 📊 Professional DCF Valuation: Built-in formulas calculate Heidrick & Struggles' intrinsic value using the Discounted Cash Flow method.
- ⚡ Instant Results: Visualize Heidrick & Struggles' valuation instantly after making changes.
- Scenario Analysis: Test and compare outcomes for various financial assumptions side-by-side.
How It Works
- Download: Obtain the pre-built Excel file containing Heidrick & Struggles International, Inc.'s (HSII) financial data.
- Customize: Modify projections, such as revenue growth, EBITDA %, and WACC.
- Update Automatically: The intrinsic value and NPV calculations refresh in real-time.
- Test Scenarios: Develop various forecasts and instantly compare results.
- Make Decisions: Leverage the valuation outcomes to inform your investment approach.
Why Choose Heidrick & Struggles International, Inc. (HSII)?
- Expertise You Can Trust: Benefit from decades of experience in executive search and consulting.
- Global Reach: Access a vast network of professionals and insights across various industries.
- Tailored Solutions: Customized strategies that align with your unique organizational needs.
- Data-Driven Insights: Leverage advanced analytics to inform your leadership decisions.
- Commitment to Diversity: Focused on fostering inclusive leadership and diverse talent pipelines.
Who Should Use Heidrick & Struggles International, Inc. (HSII)?
- Corporate Leaders: Leverage expert insights to make strategic leadership decisions.
- Talent Acquisition Professionals: Streamline your recruitment process with tailored solutions for finding top talent.
- Consultants: Utilize our resources to enhance client engagements and provide impactful recommendations.
- Business Students: Gain practical knowledge of executive search and leadership consulting through real-world case studies.
- Investors: Analyze market trends and company performance to inform investment strategies.
What the Template Contains
- Historical Data: Includes Heidrick & Struggles International, Inc.'s (HSII) past financials and baseline forecasts.
- DCF and Levered DCF Models: Detailed templates to calculate Heidrick & Struggles International, Inc.'s (HSII) intrinsic value.
- WACC Sheet: Pre-built calculations for Weighted Average Cost of Capital.
- Editable Inputs: Modify key drivers like growth rates, EBITDA %, and CAPEX assumptions.
- Quarterly and Annual Statements: A complete breakdown of Heidrick & Struggles International, Inc.'s (HSII) financials.
- Interactive Dashboard: Visualize valuation results and projections dynamically.
Disclaimer
All information, articles, and product details provided on this website are for general informational and educational purposes only. We do not claim any ownership over, nor do we intend to infringe upon, any trademarks, copyrights, logos, brand names, or other intellectual property mentioned or depicted on this site. Such intellectual property remains the property of its respective owners, and any references here are made solely for identification or informational purposes, without implying any affiliation, endorsement, or partnership.
We make no representations or warranties, express or implied, regarding the accuracy, completeness, or suitability of any content or products presented. Nothing on this website should be construed as legal, tax, investment, financial, medical, or other professional advice. In addition, no part of this site—including articles or product references—constitutes a solicitation, recommendation, endorsement, advertisement, or offer to buy or sell any securities, franchises, or other financial instruments, particularly in jurisdictions where such activity would be unlawful.
All content is of a general nature and may not address the specific circumstances of any individual or entity. It is not a substitute for professional advice or services. Any actions you take based on the information provided here are strictly at your own risk. You accept full responsibility for any decisions or outcomes arising from your use of this website and agree to release us from any liability in connection with your use of, or reliance upon, the content or products found herein.