
|
Valoración DCF de Haverty Furniture Companies, Inc. (HVT) |
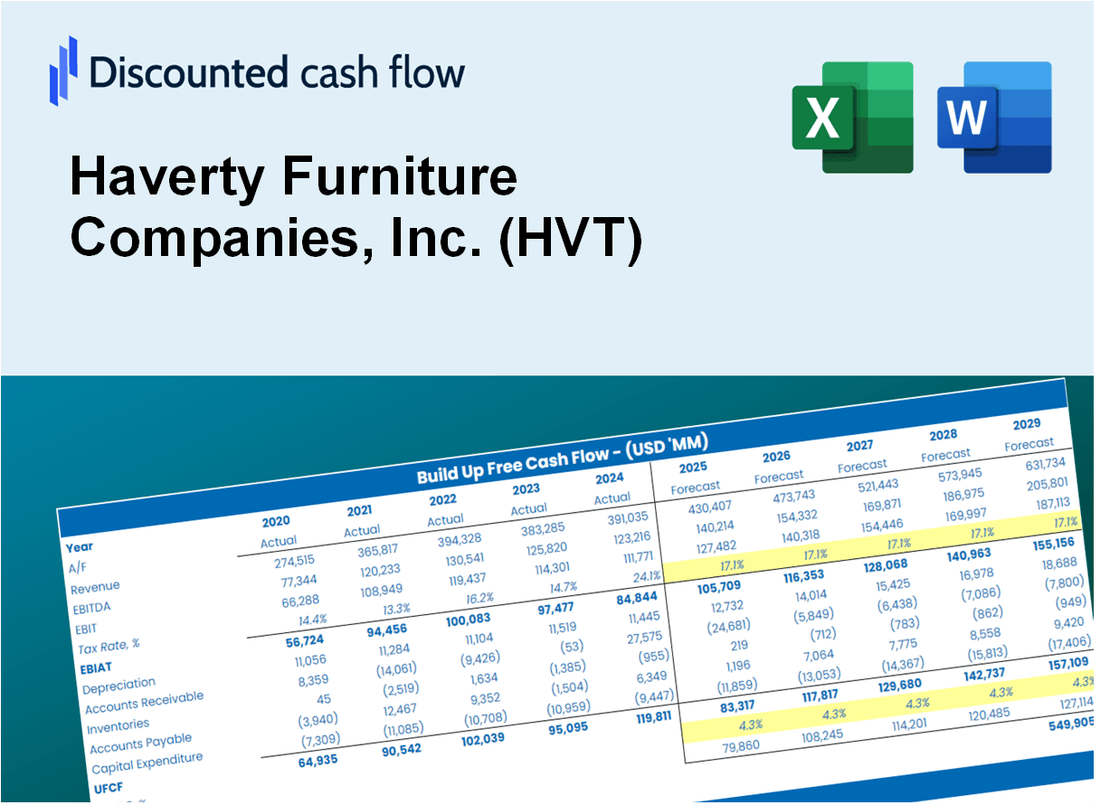
Completamente Editable: Adáptelo A Sus Necesidades En Excel O Sheets
Diseño Profesional: Plantillas Confiables Y Estándares De La Industria
Predeterminadas Para Un Uso Rápido Y Eficiente
Compatible con MAC / PC, completamente desbloqueado
No Se Necesita Experiencia; Fáciles De Seguir
Haverty Furniture Companies, Inc. (HVT) Bundle
¡Mejore sus opciones de inversión con la calculadora DCF (HVT)! Revise los datos financieros de los muebles de Havy auténticos, ajuste las estimaciones y gastos de crecimiento, y observe instantáneamente cómo estas alteraciones afectan el valor intrínseco de (HVT).
What You Will Get
- Pre-Filled Financial Model: Haverty Furniture's actual data enables precise DCF valuation.
- Full Forecast Control: Adjust revenue growth, margins, WACC, and other key drivers.
- Instant Calculations: Automatic updates ensure you see results as you make changes.
- Investor-Ready Template: A refined Excel file designed for professional-grade valuation.
- Customizable and Reusable: Tailored for flexibility, allowing repeated use for detailed forecasts.
Key Features
- Customizable Financial Inputs: Adjust essential metrics such as sales growth, operating margins, and capital investments.
- Instant DCF Valuation: Provides immediate calculations for intrinsic value, NPV, and additional financial metrics.
- High-Precision Results: Leverages Haverty’s actual financial data for accurate valuation assessments.
- Effortless Scenario Testing: Evaluate various assumptions and easily compare the resulting impacts.
- Efficiency Booster: Streamlines the valuation process, removing the necessity to create intricate models from the ground up.
How It Works
- Step 1: Download the Excel file.
- Step 2: Review pre-entered Haverty Furniture data (historical and projected).
- Step 3: Adjust key assumptions (yellow cells) based on your analysis.
- Step 4: View automatic recalculations for Haverty Furniture’s intrinsic value.
- Step 5: Use the outputs for investment decisions or reporting.
Why Choose Haverty Furniture Companies, Inc. (HVT)?
- Quality Craftsmanship: Each piece is designed with attention to detail and durability.
- Wide Selection: A diverse range of styles and furnishings to suit every taste and need.
- Exceptional Customer Service: Our team is dedicated to providing a seamless shopping experience.
- Competitive Pricing: High-quality furniture at prices that fit your budget.
- Trusted Brand: A long-standing reputation for excellence in the furniture industry.
Who Should Use This Product?
- Interior Designers: Utilize design principles and apply them to real-world furniture layouts.
- Retail Analysts: Integrate industry benchmarks and performance metrics into your evaluations.
- Homeowners: Explore furniture options and assess the value of pieces from Haverty Furniture.
- Investors: Analyze market trends and forecast potential returns on investments in HVT.
- Small Business Owners: Understand how to effectively source and evaluate furniture for commercial spaces.
What the Template Contains
- Comprehensive DCF Model: Editable template with detailed valuation calculations tailored for Haverty Furniture Companies, Inc. (HVT).
- Real-World Data: Haverty’s historical and projected financials preloaded for thorough analysis.
- Customizable Parameters: Modify WACC, growth rates, and tax assumptions to explore various scenarios.
- Financial Statements: Complete annual and quarterly breakdowns for in-depth insights.
- Key Ratios: Integrated analysis for profitability, efficiency, and leverage specific to Haverty Furniture.
- Dashboard with Visual Outputs: Charts and tables designed for clear, actionable results.
Disclaimer
All information, articles, and product details provided on this website are for general informational and educational purposes only. We do not claim any ownership over, nor do we intend to infringe upon, any trademarks, copyrights, logos, brand names, or other intellectual property mentioned or depicted on this site. Such intellectual property remains the property of its respective owners, and any references here are made solely for identification or informational purposes, without implying any affiliation, endorsement, or partnership.
We make no representations or warranties, express or implied, regarding the accuracy, completeness, or suitability of any content or products presented. Nothing on this website should be construed as legal, tax, investment, financial, medical, or other professional advice. In addition, no part of this site—including articles or product references—constitutes a solicitation, recommendation, endorsement, advertisement, or offer to buy or sell any securities, franchises, or other financial instruments, particularly in jurisdictions where such activity would be unlawful.
All content is of a general nature and may not address the specific circumstances of any individual or entity. It is not a substitute for professional advice or services. Any actions you take based on the information provided here are strictly at your own risk. You accept full responsibility for any decisions or outcomes arising from your use of this website and agree to release us from any liability in connection with your use of, or reliance upon, the content or products found herein.