
|
Valoración DCF de Jiayin Group Inc. (JFIN) |
Completamente Editable: Adáptelo A Sus Necesidades En Excel O Sheets
Diseño Profesional: Plantillas Confiables Y Estándares De La Industria
Predeterminadas Para Un Uso Rápido Y Eficiente
Compatible con MAC / PC, completamente desbloqueado
No Se Necesita Experiencia; Fáciles De Seguir
Jiayin Group Inc. (JFIN) Bundle
¡Explore el futuro financiero de Jiayin Group Inc. (JFIN) con nuestra calculadora DCF fácil de usar! Ingrese sus predicciones de crecimiento, márgenes y gastos para calcular el valor intrínseco de Jiayin Group Inc. (JFIN) y mejorar su estrategia de inversión.
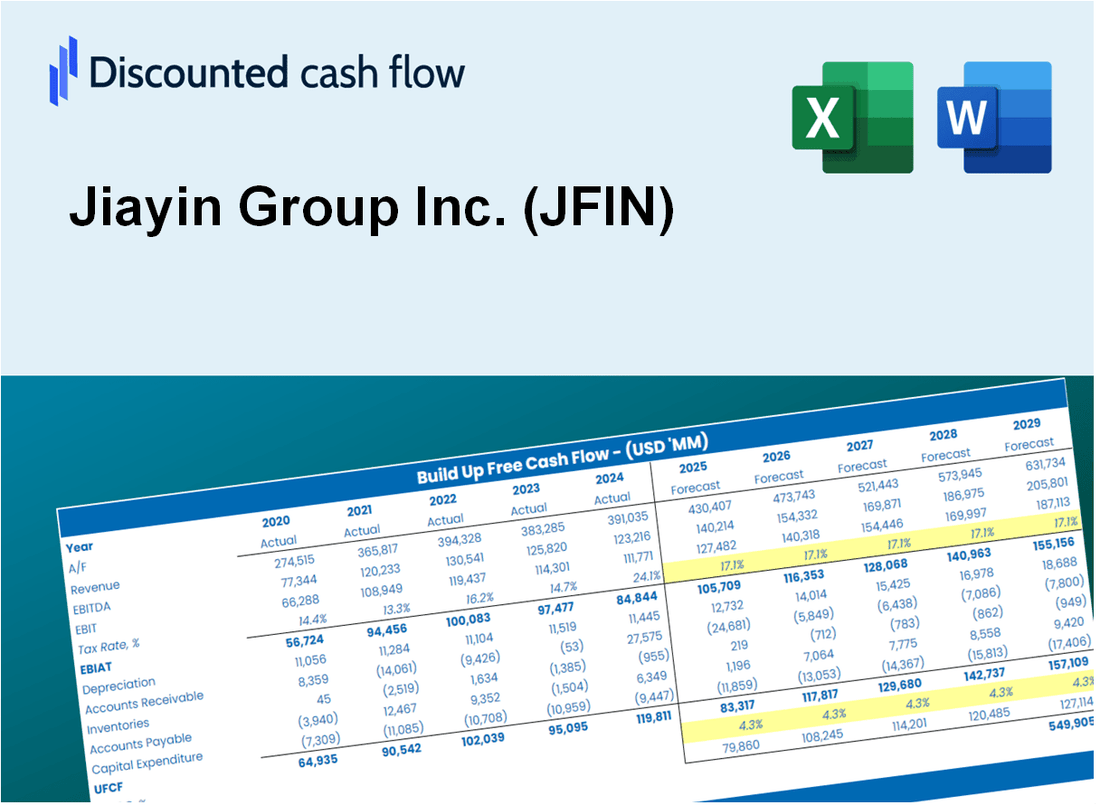
Discounted Cash Flow (DCF) - (USD MM)
| Year | AY1 2020 |
AY2 2021 |
AY3 2022 |
AY4 2023 |
AY5 2024 |
FY1 2025 |
FY2 2026 |
FY3 2027 |
FY4 2028 |
FY5 2029 |
|---|---|---|---|---|---|---|---|---|---|---|
| Revenue | 182.8 | 250.3 | 459.9 | 768.5 | 815.5 | 1,210.8 | 1,797.7 | 2,669.2 | 3,963.1 | 5,884.3 |
| Revenue Growth, % | 0 | 36.94 | 83.74 | 67.11 | 6.11 | 48.48 | 48.48 | 48.48 | 48.48 | 48.48 |
| EBITDA | 45.7 | 62.9 | 167.6 | 188.6 | 178.0 | 322.0 | 478.1 | 709.8 | 1,053.9 | 1,564.8 |
| EBITDA, % | 25.02 | 25.14 | 36.44 | 24.55 | 21.82 | 26.59 | 26.59 | 26.59 | 26.59 | 26.59 |
| Depreciation | 3.3 | 2.2 | 1.4 | 1.3 | 2.5 | 8.3 | 12.4 | 18.4 | 27.3 | 40.6 |
| Depreciation, % | 1.78 | 0.88032 | 0.30449 | 0.17306 | 0.3081 | 0.68943 | 0.68943 | 0.68943 | 0.68943 | 0.68943 |
| EBIT | 42.5 | 60.7 | 166.2 | 187.3 | 175.4 | 313.6 | 465.7 | 691.4 | 1,026.6 | 1,524.2 |
| EBIT, % | 23.24 | 24.26 | 36.13 | 24.37 | 21.51 | 25.9 | 25.9 | 25.9 | 25.9 | 25.9 |
| Total Cash | 16.5 | 25.7 | 40.9 | 52.0 | 76.0 | 107.2 | 159.1 | 236.3 | 350.8 | 520.9 |
| Total Cash, percent | .0 | .0 | .0 | .0 | .0 | .0 | .0 | .0 | .0 | .0 |
| Account Receivables | 22.2 | 70.6 | 287.5 | 566.9 | 490.7 | 573.5 | 851.5 | 1,264.3 | 1,877.2 | 2,787.2 |
| Account Receivables, % | 12.16 | 28.22 | 62.53 | 73.76 | 60.17 | 47.37 | 47.37 | 47.37 | 47.37 | 47.37 |
| Inventories | .0 | -5.2 | .3 | .0 | .0 | -4.9 | -7.3 | -10.9 | -16.1 | -24.0 |
| Inventories, % | 0 | -2.1 | 0.0618387 | 0 | 0 | -0.40713 | -0.40713 | -0.40713 | -0.40713 | -0.40713 |
| Accounts Payable | .0 | .0 | .0 | .0 | .0 | .0 | .0 | .0 | .0 | .0 |
| Accounts Payable, % | 0 | 0 | 0 | 0 | 0 | 0 | 0 | 0 | 0 | 0 |
| Capital Expenditure | -.1 | -.4 | -16.8 | -4.4 | -103.9 | -41.6 | -61.8 | -91.8 | -136.3 | -202.4 |
| Capital Expenditure, % | -0.06522274 | -0.15546 | -3.66 | -0.57697 | -12.74 | -3.44 | -3.44 | -3.44 | -3.44 | -3.44 |
| Tax Rate, % | 18.44 | 18.44 | 18.44 | 18.44 | 18.44 | 18.44 | 18.44 | 18.44 | 18.44 | 18.44 |
| EBITAT | 29.9 | 48.3 | 146.8 | 157.3 | 143.1 | 253.3 | 376.1 | 558.5 | 829.2 | 1,231.2 |
| Depreciation | ||||||||||
| Changes in Account Receivables | ||||||||||
| Changes in Inventories | ||||||||||
| Changes in Accounts Payable | ||||||||||
| Capital Expenditure | ||||||||||
| UFCF | 10.8 | 7.0 | -91.1 | -124.8 | 117.9 | 142.1 | 51.1 | 75.8 | 112.6 | 167.2 |
| WACC, % | 6.91 | 6.93 | 6.95 | 6.94 | 6.94 | 6.94 | 6.94 | 6.94 | 6.94 | 6.94 |
| PV UFCF | ||||||||||
| SUM PV UFCF | 445.3 | |||||||||
| Long Term Growth Rate, % | 2.00 | |||||||||
| Free cash flow (T + 1) | 171 | |||||||||
| Terminal Value | 3,455 | |||||||||
| Present Terminal Value | 2,471 | |||||||||
| Enterprise Value | 2,916 | |||||||||
| Net Debt | -69 | |||||||||
| Equity Value | 2,985 | |||||||||
| Diluted Shares Outstanding, MM | 13 | |||||||||
| Equity Value Per Share | 224.82 |
What You Will Get
- Editable Forecast Inputs: Easily modify key assumptions (growth %, margins, WACC) to explore various scenarios.
- Real-World Data: Jiayin Group Inc. (JFIN)’s financial data pre-loaded to kickstart your analysis.
- Automatic DCF Outputs: The template automatically computes Net Present Value (NPV) and intrinsic value for your convenience.
- Customizable and Professional: A sleek Excel model that can be tailored to fit your valuation requirements.
- Built for Analysts and Investors: Perfect for evaluating projections, validating strategies, and enhancing efficiency.
Key Features
- Accurate Jiayin Financial Data: Access reliable pre-loaded historical figures and future forecasts.
- Tailored Forecast Inputs: Modify yellow-highlighted fields such as WACC, growth rates, and profit margins.
- Real-Time Calculations: Automatic adjustments to DCF, Net Present Value (NPV), and cash flow assessments.
- Interactive Dashboard: User-friendly charts and summaries to clearly present your valuation findings.
- Designed for All Skill Levels: An intuitive layout suitable for investors, CFOs, and consultants alike.
How It Works
- Step 1: Download the prebuilt Excel template featuring Jiayin Group Inc.'s (JFIN) data.
- Step 2: Navigate through the pre-filled sheets to grasp the essential metrics.
- Step 3: Modify forecasts and assumptions in the editable yellow cells (WACC, growth, margins).
- Step 4: Instantly see updated results, including Jiayin Group Inc.'s (JFIN) intrinsic value.
- Step 5: Make well-informed investment decisions or create reports based on the outputs.
Why Choose Jiayin Group Inc. (JFIN)?
- Streamlined Processes: Our platform eliminates the hassle of manual calculations – it's ready for immediate use.
- Enhanced Precision: Accurate financial insights and methodologies minimize valuation discrepancies.
- Completely Adaptable: Modify the model to suit your unique assumptions and forecasts.
- User-Friendly Design: Intuitive visuals and outputs facilitate straightforward analysis of results.
- Endorsed by Professionals: Crafted for experts who prioritize accuracy and functionality.
Who Should Use This Product?
- Finance Students: Explore financial modeling techniques and apply them to real-world data using Jiayin Group Inc. (JFIN).
- Academics: Integrate advanced valuation models into your academic courses or research projects related to Jiayin Group Inc. (JFIN).
- Investors: Validate your investment hypotheses and assess valuation results for Jiayin Group Inc. (JFIN).
- Analysts: Enhance your analysis process with a ready-to-use, customizable DCF model tailored for Jiayin Group Inc. (JFIN).
- Small Business Owners: Understand the analytical frameworks used for evaluating large public companies like Jiayin Group Inc. (JFIN).
What the Template Contains
- Historical Data: Includes Jiayin Group Inc.'s (JFIN) past financials and baseline forecasts.
- DCF and Levered DCF Models: Detailed templates to calculate Jiayin Group Inc.'s (JFIN) intrinsic value.
- WACC Sheet: Pre-built calculations for Weighted Average Cost of Capital.
- Editable Inputs: Modify key drivers like growth rates, EBITDA %, and CAPEX assumptions.
- Quarterly and Annual Statements: A complete breakdown of Jiayin Group Inc.'s (JFIN) financials.
- Interactive Dashboard: Visualize valuation results and projections dynamically.
Disclaimer
All information, articles, and product details provided on this website are for general informational and educational purposes only. We do not claim any ownership over, nor do we intend to infringe upon, any trademarks, copyrights, logos, brand names, or other intellectual property mentioned or depicted on this site. Such intellectual property remains the property of its respective owners, and any references here are made solely for identification or informational purposes, without implying any affiliation, endorsement, or partnership.
We make no representations or warranties, express or implied, regarding the accuracy, completeness, or suitability of any content or products presented. Nothing on this website should be construed as legal, tax, investment, financial, medical, or other professional advice. In addition, no part of this site—including articles or product references—constitutes a solicitation, recommendation, endorsement, advertisement, or offer to buy or sell any securities, franchises, or other financial instruments, particularly in jurisdictions where such activity would be unlawful.
All content is of a general nature and may not address the specific circumstances of any individual or entity. It is not a substitute for professional advice or services. Any actions you take based on the information provided here are strictly at your own risk. You accept full responsibility for any decisions or outcomes arising from your use of this website and agree to release us from any liability in connection with your use of, or reliance upon, the content or products found herein.