
|
Valoración de DCF JSW Energy Limited (JSWenergy.NS) |
Completamente Editable: Adáptelo A Sus Necesidades En Excel O Sheets
Diseño Profesional: Plantillas Confiables Y Estándares De La Industria
Predeterminadas Para Un Uso Rápido Y Eficiente
Compatible con MAC / PC, completamente desbloqueado
No Se Necesita Experiencia; Fáciles De Seguir
JSW Energy Limited (JSWENERGY.NS) Bundle
¡Explore las perspectivas financieras de JSW Energy Limited (JSWenergyns) con nuestra calculadora DCF fácil de usar! Ingrese sus suposiciones con respecto al crecimiento, los márgenes y los costos para calcular el valor intrínseco de JSW Energy Limited (JSWenergyns) y mejorar su estrategia de inversión.
What You Will Receive
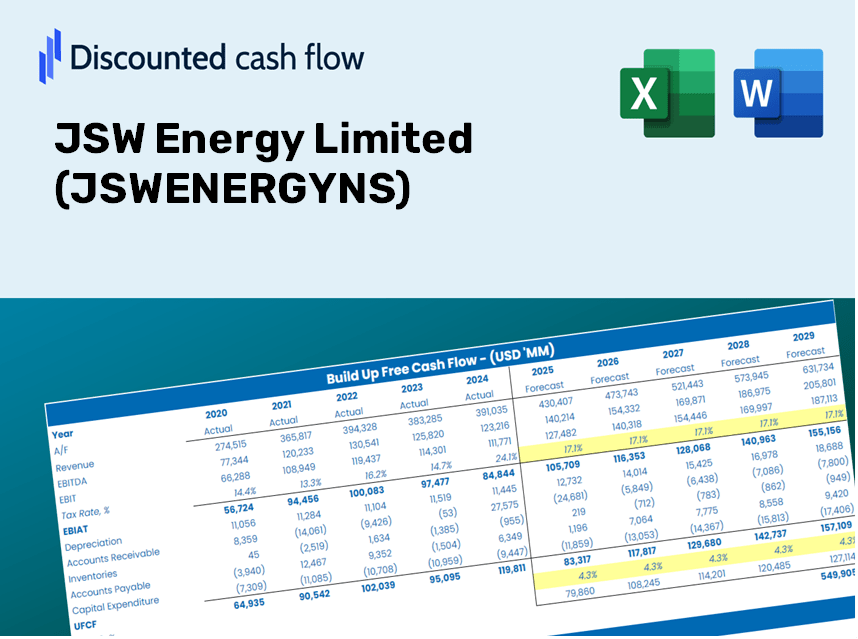
- Customizable Excel Template: A fully adjustable Excel-based DCF Calculator featuring pre-populated financials for JSW Energy Limited (JSWENERGYNS).
- Comprehensive Data: Access to historical data along with forward-looking projections (highlighted in the yellow cells).
- Assumption Flexibility: Modify forecasting variables such as revenue growth, EBITDA percentage, and WACC.
- Instant Calculations: Quickly observe how your inputs influence the valuation of JSW Energy Limited (JSWENERGYNS).
- Professional Resource: Designed for use by investors, CFOs, consultants, and financial analysts.
- Intuitive Layout: Organized for simplicity and efficiency, complete with step-by-step guidance.
Key Features
- Comprehensive DCF Calculator: Offers detailed unleveraged and leveraged DCF valuation frameworks.
- WACC Tool: Built-in Weighted Average Cost of Capital worksheet with adjustable parameters.
- Customizable Forecast Assumptions: Adjust growth rates, capital investments, and discount rates as needed.
- Integrated Financial Ratios: Evaluate profitability, leverage, and efficiency ratios for JSW Energy Limited (JSWENERGYNS).
- User-Friendly Dashboard and Charts: Visual representations highlight essential valuation metrics for simplified analysis.
How It Works
- Step 1: Download the Excel file for JSW Energy Limited (JSWENERGYNS).
- Step 2: Examine the pre-filled financial data and projections for JSW Energy.
- Step 3: Adjust key inputs such as revenue growth, WACC, and tax rates (indicated by highlighted cells).
- Step 4: Observe the DCF model update in real-time as you modify your assumptions.
- Step 5: Evaluate the outputs and apply the findings to inform your investment choices.
Why Opt for This Calculator?
- Designed for Experts: A sophisticated tool favored by analysts, CFOs, and consultants.
- Actual Data: JSW Energy Limited’s (JSWENERGYNS) historical and projected financials are preloaded to ensure precision.
- Scenario Analysis: Effortlessly simulate various forecasts and assumptions.
- Clear Results: Instantly calculates intrinsic value, NPV, and crucial metrics.
- User-Friendly: Step-by-step guidance leads you seamlessly through the process.
Who Can Benefit from JSW Energy Limited (JSWENERGYNS)?
- Investors: Make informed investment choices with a reliable valuation tool tailored for the energy sector.
- Financial Analysts: Save valuable time with our ready-to-use DCF model that can be easily customized.
- Consultants: Swiftly modify the template for impactful client presentations or detailed reports.
- Energy Sector Enthusiasts: Enhance your grasp of valuation techniques through practical, real-world examples related to JSW Energy.
- Educators and Students: Utilize this resource as a hands-on learning tool in finance and energy management courses.
Contents of the Template
- Operating and Balance Sheet Data: Pre-filled historical data and projections for JSW Energy Limited (JSWENERGYNS), including revenue, EBITDA, EBIT, and capital expenditures.
- WACC Calculation: A dedicated worksheet for calculating the Weighted Average Cost of Capital (WACC), featuring parameters such as Beta, risk-free rate, and share price.
- DCF Valuation (Unlevered and Levered): Customizable Discounted Cash Flow models that present intrinsic value along with thorough calculations.
- Financial Statements: Pre-loaded annual and quarterly financial statements to facilitate in-depth analysis.
- Key Ratios: A collection of profitability, leverage, and efficiency ratios specific to JSW Energy Limited (JSWENERGYNS).
- Dashboard and Charts: A visual summary of valuation outputs and underlying assumptions for easier result analysis.
Disclaimer
All information, articles, and product details provided on this website are for general informational and educational purposes only. We do not claim any ownership over, nor do we intend to infringe upon, any trademarks, copyrights, logos, brand names, or other intellectual property mentioned or depicted on this site. Such intellectual property remains the property of its respective owners, and any references here are made solely for identification or informational purposes, without implying any affiliation, endorsement, or partnership.
We make no representations or warranties, express or implied, regarding the accuracy, completeness, or suitability of any content or products presented. Nothing on this website should be construed as legal, tax, investment, financial, medical, or other professional advice. In addition, no part of this site—including articles or product references—constitutes a solicitation, recommendation, endorsement, advertisement, or offer to buy or sell any securities, franchises, or other financial instruments, particularly in jurisdictions where such activity would be unlawful.
All content is of a general nature and may not address the specific circumstances of any individual or entity. It is not a substitute for professional advice or services. Any actions you take based on the information provided here are strictly at your own risk. You accept full responsibility for any decisions or outcomes arising from your use of this website and agree to release us from any liability in connection with your use of, or reliance upon, the content or products found herein.