
|
Análisis de las 5 Fuerzas de Lamar Advertising Company (LAMR) [Actualizado en enero de 2025] |
Completamente Editable: Adáptelo A Sus Necesidades En Excel O Sheets
Diseño Profesional: Plantillas Confiables Y Estándares De La Industria
Predeterminadas Para Un Uso Rápido Y Eficiente
Compatible con MAC / PC, completamente desbloqueado
No Se Necesita Experiencia; Fáciles De Seguir
Lamar Advertising Company (LAMR) Bundle
En el mundo dinámico de la publicidad al aire libre, Lamar Advertising Company (LAMR) navega por un complejo panorama competitivo con forma de las cinco fuerzas de Michael Porter. Desde los desafíos estratégicos de la tecnología de cartelera digital hasta las presiones en evolución de las plataformas de marketing digital, LAMR debe equilibrar cuidadosamente las relaciones con los proveedores, las demandas de los clientes y la competencia del mercado. Esta inmersión profunda revela la intrincada dinámica que impulsa el éxito en el ecosistema publicitario moderno, ofreciendo información sobre cómo Lamr mantiene su ventaja competitiva en un entorno de medios cada vez más digital y fragmentado.
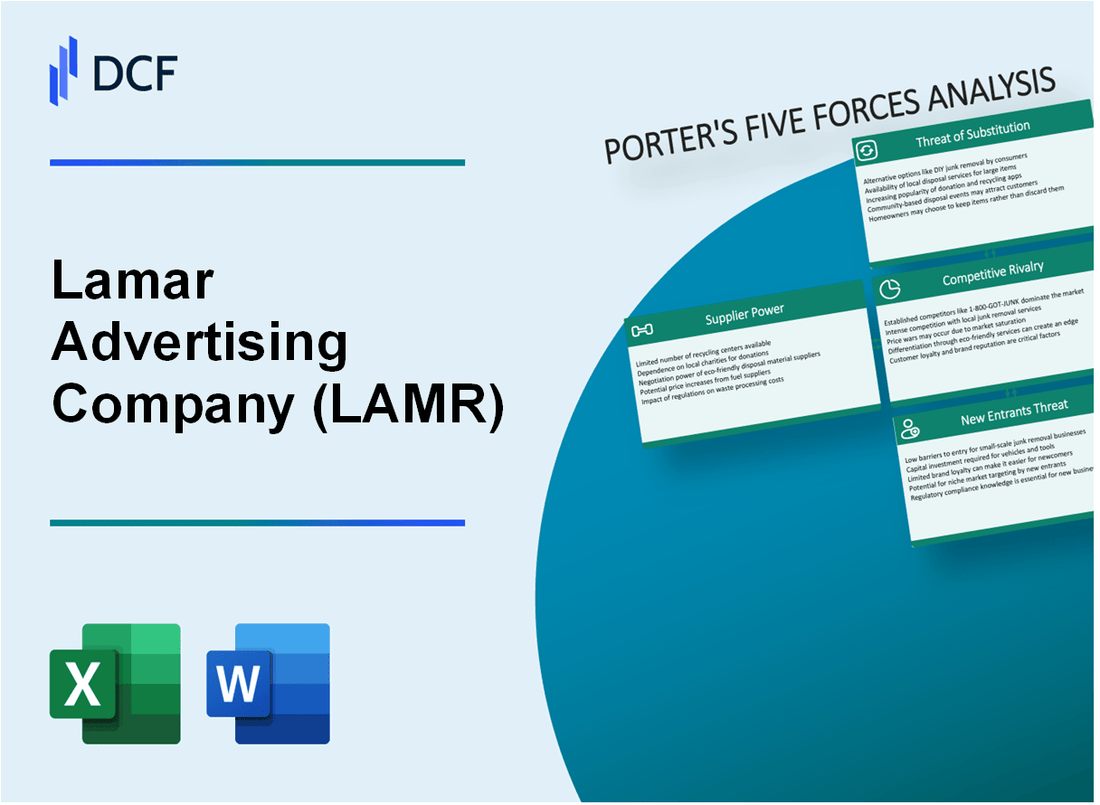
Lamar Advertising Company (LAMR) - Las cinco fuerzas de Porter: poder de negociación de los proveedores
Número limitado de fabricantes de vallas publicitarias y de visualización digital
A partir de 2024, el mercado de fabricación de exhibiciones publicitarias al aire libre se concentra con aproximadamente 3-4 fabricantes globales principales:
| Fabricante | Cuota de mercado (%) | Ingresos anuales ($ M) |
|---|---|---|
| Daktronics | 35% | $ 608.5M |
| Letreros de fuego | 25% | $ 412.3M |
| LED de Samsung | 20% | $ 535.7M |
| Otros fabricantes | 20% | $ 275.2M |
Altos costos de cambio para infraestructura de publicidad al aire libre especializada
Los costos de cambio de infraestructura publicitaria especializada al aire libre son sustanciales:
- Costo de reemplazo de cartelera digital: $ 150,000 - $ 350,000 por unidad
- Reemplazo tradicional de cartelera estática: $ 20,000 - $ 50,000 por unidad
- Gastos de instalación y configuración: $ 15,000 - $ 25,000 por ubicación
Dependencia de los proveedores de tecnología
Los proveedores de tecnología clave para los sistemas de carteles digitales incluyen:
| Proveedor de tecnología | Penetración del mercado (%) | Tarifas anuales de licencia de tecnología ($ M) |
|---|---|---|
| Broadsign International | 42% | $ 18.7M |
| Sistemas de medios de Ayuda | 28% | $ 12.4M |
| Cámping | 18% | $ 8.2M |
| Otros proveedores | 12% | $ 5.6M |
Inversiones de capital para equipos de cartelera
Requisitos de inversión de capital para equipos de cartelera en 2024:
- Gastos de capital anuales para la publicidad de Lamar: $ 85.6 millones
- Inversión promedio de infraestructura de cartelera digital: $ 275,000 por unidad
- Costo total de reemplazo de la red de cartelera digital: $ 42.3 millones anualmente
Lamar Advertising Company (LAMR) - Las cinco fuerzas de Porter: poder de negociación de los clientes
Segmentación de la base de clientes
Lamar Advertising Company atiende a 141 áreas de mercado designadas en los Estados Unidos a partir de 2023. La base de clientes incluye:
| Segmento de clientes | Porcentaje de ingresos |
|---|---|
| Anunciantes locales | 38% |
| Anunciantes regionales | 29% |
| Anunciantes nacionales | 33% |
Costos de cambio de mercado publicitario
El costo promedio de cambiar de plataformas publicitarias al aire libre oscila entre $ 5,000 y $ 15,000 por campaña, creando barreras moderadas para la migración del cliente.
Análisis de sensibilidad de precios
- Gasto publicitario promedio por cliente: $ 87,500
- Duración típica del contrato: 3-12 meses
- Elasticidad de precio en el mercado de publicidad al aire libre: 0.6
Concentración de publicidad de marca nacional
| Los mejores sectores publicitarios | Porcentaje del presupuesto publicitario total |
|---|---|
| Minorista | 22% |
| Automotor | 18% |
| Entretenimiento | 15% |
| Tecnología | 12% |
| Otros sectores | 33% |
Los ingresos totales de Lamar 2023: $ 2.1 mil millones, con un 67% de los 100 principales anunciantes nacionales.
Lamar Advertising Company (LAMR) - Las cinco fuerzas de Porter: rivalidad competitiva
Estructura del mercado publicitario al aire libre consolidado
A partir de 2024, el mercado publicitario al aire libre se caracteriza por un panorama competitivo concentrado con tres actores nacionales principales:
| Compañía | Cuota de mercado | Inventario total de cartelera |
|---|---|---|
| Publicidad Lamar | 24.7% | 170,000 vallas publicitarias |
| Clear Channel Outdoor | 22.3% | 150,000 vallas publicitarias |
| Media de fuera | 19.5% | 130,000 vallas publicitarias |
Análisis de paisaje competitivo
Métricas competitivas clave para la publicidad Lamar:
- Ingresos anuales: $ 2.1 mil millones
- Inventario de Billboard digital: 12,500 pantallas digitales
- Cobertura geográfica: 44 estados de EE. UU.
Intensidad de competencia del mercado regional
| Región | Nivel de competencia | Índice de concentración de mercado |
|---|---|---|
| Sudeste | Alto | 0.85 |
| Nordeste | Moderado | 0.72 |
| Costa oeste | Muy alto | 0.91 |
Diferenciación de tecnología digital
Comparación de inversión de cartelera digital:
- Inversión de Lamar Billboard Digital: $ 385 millones
- Inversión digital clara del canal: $ 312 millones
- Inversión digital de medios fuera defront: $ 276 millones
Lamar Advertising Company (LAMR) - Las cinco fuerzas de Porter: amenaza de sustitutos
Plataformas de marketing digital como canales de publicidad alternativa
El gasto en publicidad digital global alcanzó los $ 601.8 mil millones en 2023, lo que representa un aumento del 7.8% de 2022. Google y Facebook controlan el 52.5% del mercado de publicidad digital.
| Plataforma digital | Cuota de mercado | Ingresos anuales |
|---|---|---|
| Ads de Google | 29.1% | $ 224.5 mil millones |
| Anuncios de Facebook | 23.4% | $ 114.9 mil millones |
| Publicidad de Amazon | 14.3% | $ 37.7 mil millones |
Publicidad en las redes sociales Aumento de la presión competitiva
Los ingresos por publicidad en las redes sociales se proyectan para llegar a $ 295.8 mil millones a nivel mundial en 2024.
- Ingresos publicitarios de Tiktok: $ 18.4 mil millones en 2023
- Ingresos publicitarios de Instagram: $ 43.8 mil millones en 2023
- Ingresos publicitarios de LinkedIn: $ 12.2 mil millones en 2023
Transmisión y plataformas de publicidad en línea emergentes
Los ingresos por publicidad de transmisión global estimados en $ 72.1 mil millones en 2023.
| Plataforma de transmisión | Ingresos publicitarios | Base de usuarios |
|---|---|---|
| YouTube | $ 29.2 mil millones | 2.5 mil millones de usuarios activos mensuales |
| Hulu | $ 3.7 mil millones | 48 millones de suscriptores |
| Roku | $ 2.1 mil millones | 70 millones de cuentas activas |
Publicidad digital móvil y específica que crece en popularidad
El gasto en publicidad móvil alcanzó los $ 362.9 mil millones a nivel mundial en 2023, lo que representa el 46.5% del gasto total de publicidad digital.
- Tamaño del mercado de publicidad programática: $ 558.5 mil millones en 2023
- Tasa de clics de anuncios móviles: 4.82%
- Tasa de precisión de publicidad dirigida: 73.2%
Lamar Advertising Company (LAMR) - Las cinco fuerzas de Porter: amenaza de nuevos participantes
Altos requisitos de capital inicial para la infraestructura de cartelera
La infraestructura de cartelera de Lamar Advertising Company requiere una inversión de capital sustancial. El costo promedio de una cartelera digital oscila entre $ 250,000 y $ 1,000,000. La construcción de carteles estáticos cuesta aproximadamente $ 20,000 a $ 100,000 por ubicación.
| Tipo de cartelera | Costo de instalación promedio | Costo de mantenimiento anual |
|---|---|---|
| Cartelera digital | $650,000 | $25,000 |
| Cartelera estática | $60,000 | $5,000 |
Barreras regulatorias significativas para ubicaciones de publicidad al aire libre
Las complejidades regulatorias crean barreras de entrada sustanciales para las nuevas empresas de publicidad al aire libre.
- La Ley Federal de Embellamiento de Carreteras Restringe la colocación de carteles cerca de las carreteras
- Los municipios locales hacen cumplir las estrictas regulaciones publicitarias
- Restricciones de zonificación Limitar ubicaciones potenciales de cartelera
Procesos de zonificación y permisos locales complejos
Obtener permisos implica una amplia documentación e inversión de tiempo significativa. El proceso de permiso promedio lleva 6-18 meses, con costos que van desde $ 5,000 a $ 50,000 por ubicación.
| Tipo de permiso | Tiempo de procesamiento promedio | Costo típico |
|---|---|---|
| Permiso de cartel municipal | 9 meses | $15,000 |
| Permiso de publicidad estatal de carreteras | 12 meses | $30,000 |
Limitados ubicaciones de publicidad prima disponible en los principales mercados
La escasez del mercado aumenta significativamente las barreras de entrada. En las 20 principales áreas metropolitanas, las ubicaciones de primera placa primaria disponibles son limitadas, con tasas de ocupación superiores al 85%.
| Área metropolitana | Ubicaciones totales de cartelera | Ubicaciones disponibles |
|---|---|---|
| Los Ángeles | 3,200 | 180 |
| Ciudad de Nueva York | 2,800 | 140 |
Lamar Advertising Company (LAMR) - Porter's Five Forces: Competitive rivalry
High rivalry exists with major national REITs like OUTFRONT Media and Clear Channel Outdoor.
Lamar Advertising Company's trailing twelve month revenue stands at $2.25B, against a total US Billboard & Outdoor Advertising industry revenue estimated at $8.7bn for 2025.
The competitive intensity is visible in recent stock movements for the three months ended September 30, 2025; OUTFRONT Media stock rose 12.7%, Clear Channel Outdoor stock rose 30%, while Lamar Advertising increased only 1.3%.
Lamar Advertising Company operates as one of the largest in the space, with a market capitalization of $12B as of October 31, 2025.
The latest reported net income for Lamar Advertising Company was $438.7 million, an increase from $364.3 million the previous year.
Competition is intensifying as players aggressively convert to digital billboards.
As of the close of 2024, Lamar Advertising Company operated approximately 5,000 digital billboards and planned to deploy an additional 350-375 new digital displays in 2025.
This digital shift is significant, with digital billing accounting for 31% of Lamar Advertising Company's total billboard billing in the third quarter of 2025.
The programmatic advertising channel, a digital evolution, accounts for 2% of Lamar Advertising Company's outdoor advertising business.
The industry remains fragmented with many smaller, local operators.
In the second quarter of 2025, local advertising accounted for 79% of Lamar Advertising Company's billboard revenue, while national accounted for 21%.
Lamar Advertising Company's Q2 2025 net revenue increased 2.5% to $579 million, with billboard organic growth at 1.9%.
The competitive landscape includes several key players making strategic moves, as shown below:
| Metric | Lamar Advertising Company (LAMR) | OUTFRONT Media (OUT) | Clear Channel Outdoor (CCO) |
| Q3 2025 Stock Change (3 Months Ended Sept 30) | 1.3% | 12.7% | 30% |
| Latest Reported Net Income (Approx. Q3 2025) | $438.7 million | Data Not Available | Data Not Available |
| Latest Reported Debt (As of June 30, 2025) | $3.4 billion | Data Not Available | Data Not Available |
| Leverage Ratio (Net Debt to EBITDA, As of June 30, 2025) | 2.95 times | Data Not Available | Data Not Available |
Key competitive factors driving rivalry intensity include:
- Digital billboard deployment targets for 2025: 350-375 new displays.
- Digital billing penetration as of Q3 2025: 31% of total billboard billing.
- Lamar Advertising Company's Q2 2025 billboard organic growth: 1.9%.
- Lamar Advertising Company's Q2 2025 airport organic growth: 11.7%.
- Lamar Advertising Company's Q2 2025 logo organic growth: 6.1%.
- Lamar Advertising Company's Q2 2025 EBITDA: $278 million.
Lamar Advertising Company (LAMR) - Porter's Five Forces: Threat of substitutes
The threat of substitutes for Lamar Advertising Company is substantial, primarily stemming from the massive, well-funded digital advertising ecosystem. You see this pressure in every budget meeting, as social media platforms, search engines, and streaming services constantly fight for the same marketing dollars. While Lamar Advertising Company is successfully growing its digital OOH (Out-of-Home) segment, the sheer scale of pure-play digital advertising remains the primary external pressure point.
Rising digital media consumption definitely poses a long-term risk to the traditional, static OOH segment. The broader Out-of-Home advertising industry, while showing resilience, still competes against channels that offer hyper-targeting and immediate digital attribution. For context, the United States OOH market size is estimated at USD 9.38 billion in 2025, but the digital advertising universe dwarfs this figure. Still, the OOH sector itself is evolving; Digital OOH (DOOH) is expected to grow at a 6.2% CAGR through 2030 in the US, roughly double the rate of the overall market growth, showing where the industry's own focus is shifting to combat substitutes.
Lamar Advertising Company is actively mitigating this threat through aggressive digital billboard conversion, which is a clear financial lever. A single digital unit generates significantly more revenue than its static predecessor. Here's a quick look at the numbers from the latest reports:
| Metric | Value / Percentage | Context / Date |
|---|---|---|
| Digital Billboard Revenue Multiple vs. Static | 5x | Revenue generated per digital unit versus the prior static board. |
| Total Digital Billboard Faces in Operation | More than 5,400 | As of Lamar Advertising Company Q3 2025. |
| Digital Billing as % of Total Billboard Billing | Approximately 31% | Lamar Advertising Company Q3 2025. |
| Same-Store Digital Revenue Growth (Q-o-Q) | 3.4% | Lamar Advertising Company Q3 2025. |
| Static Billboard Revenue Growth (Q-o-Q) | Up 2% | Lamar Advertising Company Q3 2025. |
| Programmatic Revenue Growth (Q-o-Q) | Over 13% | Lamar Advertising Company Q3 2025. |
The conversion strategy is working, as evidenced by Lamar's internal growth metrics. Digital billing grew 5% in Q3 2025, while static revenue grew 2% in the same period. Furthermore, programmatic revenue, which leverages digital flexibility, grew over 13% in Q3 2025. This transition is key to maintaining relevance against substitutes that offer real-time optimization.
However, the core strength of Lamar Advertising Company, and OOH in general, is its unavoidable presence. Digital substitutes like social and search can be skipped, blocked, or ignored. OOH cannot. This physical reach translates directly into consumer action and trust. You can see this in the latest consumer data:
- OOH is the most trusted advertising format, outperforming all online channels.
- 70% of consumers recall OOH ads more than other ad formats.
- 47.7% of consumers search for the advertiser after seeing an OOH ad.
- 41% visit the advertiser's website after exposure.
This inherent, unblockable reach in high-traffic, high-value locations is the fundamental advantage that digital substitutes struggle to fully replicate, even with their data sophistication. The company's Q3 2025 net revenues reached $585 million, showing the current value derived from this physical footprint.
Lamar Advertising Company (LAMR) - Porter's Five Forces: Threat of new entrants
The threat of new entrants for Lamar Advertising Company is decidedly low, primarily because the industry structure is heavily fortified by non-replicable assets and stringent governmental controls. You can't just decide to put up a major advertising structure tomorrow; the hurdles are too high.
Regulatory Hurdles Create High Entry Barriers
The most significant barrier is the regulatory environment. Billboards located within 660 feet of federal-aid roads fall under the Highway Beautification Act (HBA) of 1965, which mandates state control over outdoor advertising or risk losing federal highway funds. Beyond federal oversight, local cities, towns, and counties impose their own sign ordinances, which can be stricter, and in almost all states, localities retain the right to ban billboards outright or restrict size and type. New entrants must navigate this complex, often contradictory, tapestry of federal, state, and municipal laws. For instance, some localities spend millions managing these rules, creating an administrative and financial burden that a startup simply won't have the infrastructure to handle. Furthermore, legislative battles, such as those seen in California regarding the definition of 'maintenance' versus new construction, show that the rules governing physical expansion are constantly contested and often favor incumbents who understand the political landscape.
Prime Real Estate Control is Nearly Impossible to Replicate
Securing the best physical locations-the high-traffic, high-visibility spots-is an almost insurmountable barrier for a newcomer. Billboard companies like Lamar Advertising Company typically do not own the underlying land; they secure long-term leases, often referred to as easements. Lamar has actively worked to solidify this by purchasing easements, owning the land under about 1 out of every 8 billboards. A new entrant would face intense competition for the remaining desirable leases, and the existing inventory of prime spots is already locked up by established players through decades-old agreements. The company's aggressive acquisition strategy, which saw them spend approximately $110 million in cash on 20 acquisitions through Q2 2025 alone, demonstrates that the primary way to gain scale is by buying existing inventory, not by building new sites in premium areas.
Capital Intensity and Existing Scale
The sheer scale of Lamar Advertising Company requires massive upfront capital that deters most new competitors. As of late 2024, Lamar operated approximately 159,000 billboard displays, including 5,000 digital billboards. If you consider the broader count including logo and transit displays, the total network size is reported to be over 360,000 displays across the U.S. and Canada. To compete, a new firm would need to match this footprint, which is prohibitively expensive. Lamar itself is planning capital expenditures and acquisitions totaling approximately $345 million in 2025, which is in line with their five-year average spend of $336 million. Here's the quick math: building out a competitive network would require hundreds of millions, if not billions, in initial outlay, a sum that dwarfs the typical startup funding available for this sector.
The existing scale translates directly into competitive advantages that new entrants struggle to overcome. Lamar's established infrastructure supports its sales efforts, which is a key differentiator.
| Metric | Lamar Advertising Company Data (Latest Available) | Context for New Entrants |
|---|---|---|
| Total Billboard Displays (End of 2024) | Approx. 159,000 | Requires immense capital to match this physical footprint. |
| Digital Billboard Displays (End of 2024) | 5,000 | Digital conversion requires significant, planned CapEx, like Lamar's projected $195 million for 2025. |
| Acquisition Spending (YTD Q2 2025) | Approx. $110 million in cash for 20 acquisitions | New entrants must compete with Lamar's stated $1 billion acquisition capacity (checkbook). |
| Total Debt (June 30, 2025) | $3.4 billion | Indicates the massive financial leverage already deployed in the sector. |
| Logo Sign Contracts (End of 2024) | 23 of 26 privatized state contracts | These government-linked contracts are effectively closed to new competition. |
Competition with Established Scale and Sales Force
New entrants cannot easily match Lamar Advertising Company's established scale and the resulting efficiencies. With over 159,000 billboard displays and a presence in 45 states and Canada, Lamar offers national reach that a startup cannot immediately promise. This scale supports a deep, established local sales force that has existing relationships with both local businesses and national brand agencies. Furthermore, Lamar has pioneered structures like the UPREIT transaction, which makes them an attractive partner for existing owners looking to sell, effectively absorbing potential competitors rather than facing them.
New entrants face difficulty competing with Lamar's established scale and local sales force.
- Regulatory complexity demands specialized legal and governmental affairs teams.
- Securing prime real estate is a decades-long process of acquisition and leasing.
- Lamar's digital network growth relies on planned CapEx of $195 million in 2025.
- The company's ability to deploy capital for acquisitions, with a $1 billion capacity, stifles smaller rivals.
- Established relationships with local governments are hard-won and difficult to displace.
Disclaimer
All information, articles, and product details provided on this website are for general informational and educational purposes only. We do not claim any ownership over, nor do we intend to infringe upon, any trademarks, copyrights, logos, brand names, or other intellectual property mentioned or depicted on this site. Such intellectual property remains the property of its respective owners, and any references here are made solely for identification or informational purposes, without implying any affiliation, endorsement, or partnership.
We make no representations or warranties, express or implied, regarding the accuracy, completeness, or suitability of any content or products presented. Nothing on this website should be construed as legal, tax, investment, financial, medical, or other professional advice. In addition, no part of this site—including articles or product references—constitutes a solicitation, recommendation, endorsement, advertisement, or offer to buy or sell any securities, franchises, or other financial instruments, particularly in jurisdictions where such activity would be unlawful.
All content is of a general nature and may not address the specific circumstances of any individual or entity. It is not a substitute for professional advice or services. Any actions you take based on the information provided here are strictly at your own risk. You accept full responsibility for any decisions or outcomes arising from your use of this website and agree to release us from any liability in connection with your use of, or reliance upon, the content or products found herein.