
|
Valoración DCF de Open Lending Corporation (LPRO) |
Completamente Editable: Adáptelo A Sus Necesidades En Excel O Sheets
Diseño Profesional: Plantillas Confiables Y Estándares De La Industria
Predeterminadas Para Un Uso Rápido Y Eficiente
Compatible con MAC / PC, completamente desbloqueado
No Se Necesita Experiencia; Fáciles De Seguir
Open Lending Corporation (LPRO) Bundle
¡Explore el potencial financiero de Open Lending Corporation (LPRO) con nuestra calculadora DCF fácil de usar! Ingrese sus suposiciones para el crecimiento, los márgenes y los gastos para calcular el valor intrínseco de Open Lending Corporation (LPRO) y mejorar su enfoque de inversión.
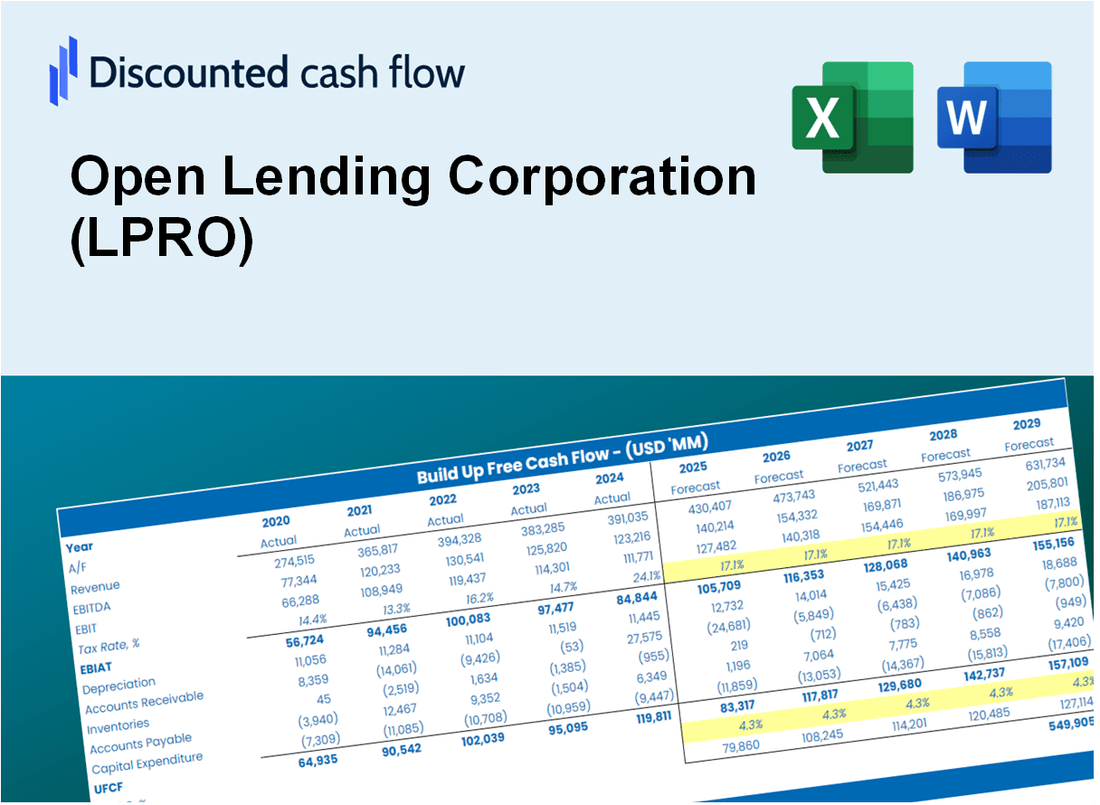
Discounted Cash Flow (DCF) - (USD MM)
| Year | AY1 2020 |
AY2 2021 |
AY3 2022 |
AY4 2023 |
AY5 2024 |
FY1 2025 |
FY2 2026 |
FY3 2027 |
FY4 2028 |
FY5 2029 |
|---|---|---|---|---|---|---|---|---|---|---|
| Revenue | 108.9 | 215.7 | 179.6 | 117.5 | 24.0 | 22.1 | 20.2 | 18.6 | 17.1 | 15.7 |
| Revenue Growth, % | 0 | 98.04 | -16.72 | -34.6 | -79.55 | -8.21 | -8.21 | -8.21 | -8.21 | -8.21 |
| EBITDA | -77.6 | 198.7 | 100.9 | 41.3 | -51.6 | .5 | .5 | .5 | .4 | .4 |
| EBITDA, % | -71.28 | 92.13 | 56.16 | 35.16 | -214.84 | 2.43 | 2.43 | 2.43 | 2.43 | 2.43 |
| Depreciation | 1.8 | 1.7 | 1.5 | 1.8 | 1.7 | .5 | .5 | .4 | .4 | .4 |
| Depreciation, % | 1.62 | 0.77253 | 0.83188 | 1.51 | 6.97 | 2.34 | 2.34 | 2.34 | 2.34 | 2.34 |
| EBIT | -79.4 | 197.0 | 99.4 | 39.5 | -53.3 | .3 | .3 | .3 | .3 | .2 |
| EBIT, % | -72.91 | 91.36 | 55.33 | 33.64 | -221.81 | 1.49 | 1.49 | 1.49 | 1.49 | 1.49 |
| Total Cash | 101.5 | 116.5 | 204.5 | 240.2 | 243.2 | 19.7 | 18.1 | 16.6 | 15.3 | 14.0 |
| Total Cash, percent | .0 | .0 | .0 | .0 | .0 | .0 | .0 | .0 | .0 | .0 |
| Account Receivables | 54.7 | 78.4 | 69.9 | 40.4 | 18.6 | 10.5 | 9.6 | 8.8 | 8.1 | 7.4 |
| Account Receivables, % | 50.27 | 36.36 | 38.9 | 34.36 | 77.36 | 47.45 | 47.45 | 47.45 | 47.45 | 47.45 |
| Inventories | 4.5 | 5.5 | 4.1 | .0 | .0 | .4 | .4 | .3 | .3 | .3 |
| Inventories, % | 4.14 | 2.57 | 2.27 | 0 | 0 | 1.79 | 1.79 | 1.79 | 1.79 | 1.79 |
| Accounts Payable | 3.4 | 1.3 | .3 | .4 | 1.0 | .4 | .3 | .3 | .3 | .3 |
| Accounts Payable, % | 3.16 | 0.59586 | 0.16036 | 0.31926 | 3.97 | 1.64 | 1.64 | 1.64 | 1.64 | 1.64 |
| Capital Expenditure | -1.2 | -2.0 | -.6 | -2.2 | -.2 | -.2 | -.2 | -.2 | -.2 | -.2 |
| Capital Expenditure, % | -1.1 | -0.92138 | -0.34745 | -1.85 | -0.68681 | -0.98165 | -0.98165 | -0.98165 | -0.98165 | -0.98165 |
| Tax Rate, % | -108.98 | -108.98 | -108.98 | -108.98 | -108.98 | -108.98 | -108.98 | -108.98 | -108.98 | -108.98 |
| EBITAT | -85.1 | 150.6 | 70.8 | 30.2 | -111.4 | .3 | .3 | .2 | .2 | .2 |
| Depreciation | ||||||||||
| Changes in Account Receivables | ||||||||||
| Changes in Inventories | ||||||||||
| Changes in Accounts Payable | ||||||||||
| Capital Expenditure | ||||||||||
| UFCF | -140.4 | 123.4 | 80.7 | 63.5 | -87.5 | 7.7 | 1.4 | 1.3 | 1.2 | 1.1 |
| WACC, % | 10.93 | 10.21 | 10.05 | 10.21 | 10.93 | 10.47 | 10.47 | 10.47 | 10.47 | 10.47 |
| PV UFCF | ||||||||||
| SUM PV UFCF | 10.5 | |||||||||
| Long Term Growth Rate, % | 2.00 | |||||||||
| Free cash flow (T + 1) | 1 | |||||||||
| Terminal Value | 13 | |||||||||
| Present Terminal Value | 8 | |||||||||
| Enterprise Value | 18 | |||||||||
| Net Debt | -99 | |||||||||
| Equity Value | 118 | |||||||||
| Diluted Shares Outstanding, MM | 119 | |||||||||
| Equity Value Per Share | 0.99 |
What You Will Get
- Real LPRO Financial Data: Pre-filled with Open Lending Corporation’s historical and projected data for precise analysis.
- Fully Editable Template: Modify key inputs like revenue growth, WACC, and EBITDA % with ease.
- Automatic Calculations: See Open Lending Corporation’s intrinsic value update instantly based on your changes.
- Professional Valuation Tool: Designed for investors, analysts, and consultants seeking accurate DCF results.
- User-Friendly Design: Simple structure and clear instructions for all experience levels.
Key Features
- Comprehensive Financial Data: Gain access to precise pre-loaded historical figures and future estimates for Open Lending Corporation (LPRO).
- Adjustable Forecast Parameters: Modify highlighted cells to customize WACC, growth rates, and profit margins.
- Automated Calculations: Instant updates for DCF, Net Present Value (NPV), and cash flow assessments.
- User-Friendly Dashboard: Clear and concise charts and summaries to help you interpret your valuation findings.
- Designed for All Skill Levels: An easy-to-navigate layout tailored for investors, CFOs, and consultants alike.
How It Works
- Download the Template: Gain immediate access to the Excel-based LPRO DCF Calculator.
- Input Your Assumptions: Modify the yellow-highlighted cells for growth rates, WACC, margins, and other variables.
- Instant Calculations: The model will automatically refresh to show Open Lending Corporation’s intrinsic value.
- Test Scenarios: Experiment with different assumptions to assess potential changes in valuation.
- Analyze and Decide: Utilize the outcomes to inform your investment or financial analysis.
Why Choose This Calculator for Open Lending Corporation (LPRO)?
- User-Friendly Interface: Perfect for both novices and seasoned professionals.
- Customizable Inputs: Adjust parameters effortlessly to suit your financial analysis.
- Real-Time Adjustments: Instantly view changes to Open Lending’s valuation as you tweak the inputs.
- Pre-Loaded Data: Comes with Open Lending’s actual financial information for immediate insights.
- Relied Upon by Experts: Favored by analysts and investors for making educated decisions.
Who Should Use This Product?
- Finance Students: Explore lending models and apply them using real-world data related to Open Lending Corporation (LPRO).
- Academics: Integrate advanced lending strategies into your coursework or research projects.
- Investors: Validate your investment hypotheses and evaluate the financial performance of Open Lending Corporation (LPRO).
- Analysts: Enhance your analysis with a user-friendly, customizable financial model tailored for Open Lending Corporation (LPRO).
- Small Business Owners: Understand the lending landscape by analyzing how companies like Open Lending Corporation (LPRO) operate.
What the Template Contains
- Preloaded LPRO Data: Historical and projected financial data, including revenue, EBIT, and capital expenditures.
- DCF and WACC Models: Professional-grade sheets for calculating intrinsic value and Weighted Average Cost of Capital.
- Editable Inputs: Yellow-highlighted cells for adjusting revenue growth, tax rates, and discount rates.
- Financial Statements: Comprehensive annual and quarterly financials for deeper analysis.
- Key Ratios: Profitability, leverage, and efficiency ratios to evaluate performance.
- Dashboard and Charts: Visual summaries of valuation outcomes and assumptions.
Disclaimer
All information, articles, and product details provided on this website are for general informational and educational purposes only. We do not claim any ownership over, nor do we intend to infringe upon, any trademarks, copyrights, logos, brand names, or other intellectual property mentioned or depicted on this site. Such intellectual property remains the property of its respective owners, and any references here are made solely for identification or informational purposes, without implying any affiliation, endorsement, or partnership.
We make no representations or warranties, express or implied, regarding the accuracy, completeness, or suitability of any content or products presented. Nothing on this website should be construed as legal, tax, investment, financial, medical, or other professional advice. In addition, no part of this site—including articles or product references—constitutes a solicitation, recommendation, endorsement, advertisement, or offer to buy or sell any securities, franchises, or other financial instruments, particularly in jurisdictions where such activity would be unlawful.
All content is of a general nature and may not address the specific circumstances of any individual or entity. It is not a substitute for professional advice or services. Any actions you take based on the information provided here are strictly at your own risk. You accept full responsibility for any decisions or outcomes arising from your use of this website and agree to release us from any liability in connection with your use of, or reliance upon, the content or products found herein.