
|
Mitchells & Valoración de DCF de Butlers PLC (MAB.L) |
Completamente Editable: Adáptelo A Sus Necesidades En Excel O Sheets
Diseño Profesional: Plantillas Confiables Y Estándares De La Industria
Predeterminadas Para Un Uso Rápido Y Eficiente
Compatible con MAC / PC, completamente desbloqueado
No Se Necesita Experiencia; Fáciles De Seguir
Mitchells & Butlers plc (MAB.L) Bundle
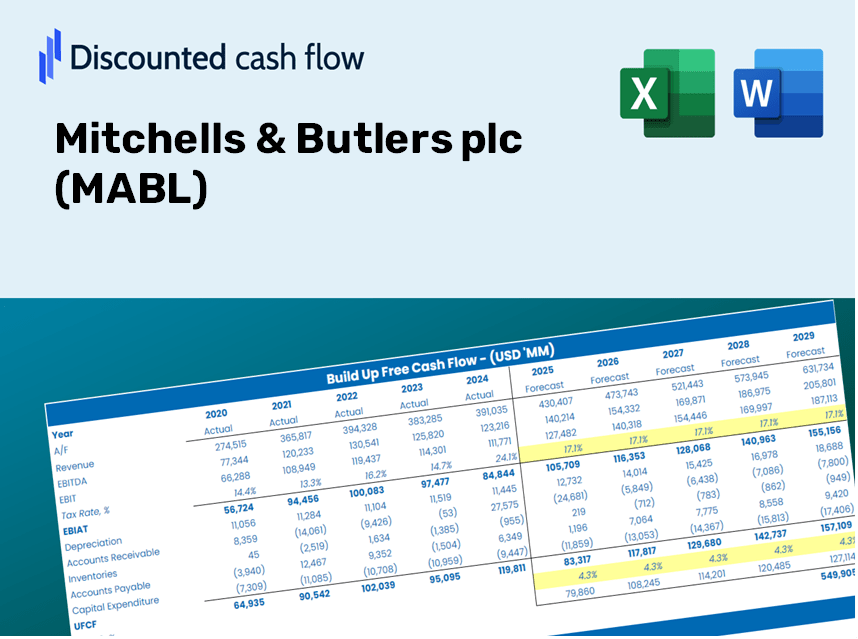
Simplifique Mitchells & ¡Valoración de Butlers PLC (MBL) con esta calculadora DCF personalizable! Con Real Mitchells & Butlers plc (mBL) finanzas y entradas de pronóstico ajustables, puede probar escenarios y descubrir Mitchells & Butlers PLC (MABL) Valor razonable en minutos.
Discounted Cash Flow (DCF) - (USD MM)
| Year | AY1 2020 |
AY2 2021 |
AY3 2022 |
AY4 2023 |
AY5 2024 |
FY1 2025 |
FY2 2026 |
FY3 2027 |
FY4 2028 |
FY5 2029 |
|---|---|---|---|---|---|---|---|---|---|---|
| Revenue | 1,475.0 | 1,065.0 | 2,208.0 | 2,503.0 | 2,610.0 | 3,196.2 | 3,914.1 | 4,793.1 | 5,869.7 | 7,188.0 |
| Revenue Growth, % | 0 | -27.8 | 107.32 | 13.36 | 4.27 | 22.46 | 22.46 | 22.46 | 22.46 | 22.46 |
| EBITDA | 159.0 | 218.0 | 255.0 | 235.0 | 438.0 | 440.9 | 539.9 | 661.2 | 809.6 | 991.5 |
| EBITDA, % | 10.78 | 20.47 | 11.55 | 9.39 | 16.78 | 13.79 | 13.79 | 13.79 | 13.79 | 13.79 |
| Depreciation | 154.0 | 139.0 | 133.0 | 133.0 | 130.0 | 254.5 | 311.6 | 381.6 | 467.3 | 572.3 |
| Depreciation, % | 10.44 | 13.05 | 6.02 | 5.31 | 4.98 | 7.96 | 7.96 | 7.96 | 7.96 | 7.96 |
| EBIT | 5.0 | 79.0 | 122.0 | 102.0 | 308.0 | 186.4 | 228.3 | 279.5 | 342.3 | 419.2 |
| EBIT, % | 0.33898 | 7.42 | 5.53 | 4.08 | 11.8 | 5.83 | 5.83 | 5.83 | 5.83 | 5.83 |
| Total Cash | 173.0 | 252.0 | 207.0 | 126.0 | 176.0 | 361.4 | 442.6 | 542.0 | 663.8 | 812.9 |
| Total Cash, percent | .0 | .0 | .0 | .0 | .0 | .0 | .0 | .0 | .0 | .0 |
| Account Receivables | 7.0 | 10.0 | 14.0 | 33.0 | 29.0 | 28.6 | 35.0 | 42.9 | 52.6 | 64.4 |
| Account Receivables, % | 0.47458 | 0.93897 | 0.63406 | 1.32 | 1.11 | 0.89543 | 0.89543 | 0.89543 | 0.89543 | 0.89543 |
| Inventories | 22.0 | 19.0 | 23.0 | 25.0 | 27.0 | 40.6 | 49.7 | 60.9 | 74.6 | 91.3 |
| Inventories, % | 1.49 | 1.78 | 1.04 | 0.9988 | 1.03 | 1.27 | 1.27 | 1.27 | 1.27 | 1.27 |
| Accounts Payable | 69.0 | 80.0 | 106.0 | 100.0 | 114.0 | 162.1 | 198.5 | 243.0 | 297.6 | 364.5 |
| Accounts Payable, % | 4.68 | 7.51 | 4.8 | 4 | 4.37 | 5.07 | 5.07 | 5.07 | 5.07 | 5.07 |
| Capital Expenditure | -108.0 | -33.0 | -122.0 | -157.0 | -154.0 | -179.7 | -220.1 | -269.6 | -330.1 | -404.2 |
| Capital Expenditure, % | -7.32 | -3.1 | -5.53 | -6.27 | -5.9 | -5.62 | -5.62 | -5.62 | -5.62 | -5.62 |
| Tax Rate, % | 25.13 | 25.13 | 25.13 | 25.13 | 25.13 | 25.13 | 25.13 | 25.13 | 25.13 | 25.13 |
| EBITAT | 4.6 | 122.3 | 198.3 | 31.4 | 230.6 | 147.9 | 181.1 | 221.8 | 271.6 | 332.6 |
| Depreciation | ||||||||||
| Changes in Account Receivables | ||||||||||
| Changes in Inventories | ||||||||||
| Changes in Accounts Payable | ||||||||||
| Capital Expenditure | ||||||||||
| UFCF | 90.6 | 239.3 | 227.3 | -19.6 | 222.6 | 257.5 | 293.5 | 359.4 | 440.1 | 538.9 |
| WACC, % | 7.99 | 8.31 | 8.31 | 5.85 | 7.41 | 7.57 | 7.57 | 7.57 | 7.57 | 7.57 |
| PV UFCF | ||||||||||
| SUM PV UFCF | 1,484.4 | |||||||||
| Long Term Growth Rate, % | 3.50 | |||||||||
| Free cash flow (T + 1) | 558 | |||||||||
| Terminal Value | 13,695 | |||||||||
| Present Terminal Value | 9,507 | |||||||||
| Enterprise Value | 10,992 | |||||||||
| Net Debt | 1,455 | |||||||||
| Equity Value | 9,537 | |||||||||
| Diluted Shares Outstanding, MM | 600 | |||||||||
| Equity Value Per Share | 1,589.42 |
What You Will Receive
- Authentic MABL Financial Data: Pre-populated with Mitchells & Butlers plc’s historical and forecasted figures for precise assessments.
- Completely Customizable Template: Easily adjust essential inputs such as revenue growth, WACC, and EBITDA percentage.
- Instant Calculations: Observe the real-time updates of Mitchells & Butlers’ intrinsic value as you make changes.
- Professional Valuation Tool: Tailored for investors, analysts, and consultants aiming for accurate DCF analyses.
- Intuitive Design: Streamlined layout and straightforward guidance suitable for every skill level.
Key Features
- 🔍 Real-Life MABL Financials: Pre-filled historical and projected data for Mitchells & Butlers plc (MABL).
- ✏️ Fully Customizable Inputs: Tailor essential parameters (yellow cells) such as WACC, growth %, and tax rates.
- 📊 Professional DCF Valuation: Integrated formulas calculate the intrinsic value of Mitchells & Butlers using the Discounted Cash Flow method.
- ⚡ Instant Results: Visualize the valuation of Mitchells & Butlers immediately after adjustments.
- Scenario Analysis: Evaluate and compare outcomes based on diverse financial assumptions side-by-side.
How It Operates
- Download the Template: Gain immediate access to the Excel-based MABL DCF Calculator.
- Input Your Assumptions: Modify the yellow-highlighted cells for growth rates, WACC, margins, and other relevant factors.
- Instant Calculations: The model automatically calculates the intrinsic value of Mitchells & Butlers plc (MABL).
- Test Scenarios: Experiment with various assumptions to assess potential changes in valuation.
- Analyze and Decide: Utilize the results to inform your investment or financial strategy.
Why Opt for This Calculator?
- Precise Data: Authentic Mitchells & Butlers plc (MABL) financials deliver trustworthy valuation outcomes.
- Adaptable: Tailor essential parameters such as growth rates, WACC, and tax rates to align with your forecasts.
- Efficiency Boost: Ready-made calculations save you from starting anew.
- Professional-Quality Tool: Crafted for investors, analysts, and consultants in the industry.
- Easy to Use: Intuitive design and clear, step-by-step guidance make it accessible for everyone.
Who Can Benefit from This Product?
- Investors: Gain assurance in your investment choices with a top-tier valuation tool.
- Financial Analysts: Streamline your workflow with a customizable, pre-designed DCF model.
- Consultants: Effortlessly modify the template for client meetings or reports.
- Finance Enthusiasts: Enhance your grasp of valuation methods through practical, real-life scenarios.
- Educators and Students: Utilize this as an effective resource for finance-focused coursework.
Contents of the Template
- Detailed DCF Model: Editable template featuring in-depth valuation calculations.
- Real-World Data: Historical and projected financials for Mitchells & Butlers plc (MABL) preloaded for analysis.
- Customizable Inputs: Modify WACC, growth rates, and tax assumptions to explore various scenarios.
- Financial Statements: Comprehensive annual and quarterly breakdowns for deeper insights.
- Key Financial Ratios: In-built analysis for assessing profitability, efficiency, and leverage.
- Interactive Dashboard with Visual Outputs: Charts and tables designed for clear, actionable insights.
Disclaimer
All information, articles, and product details provided on this website are for general informational and educational purposes only. We do not claim any ownership over, nor do we intend to infringe upon, any trademarks, copyrights, logos, brand names, or other intellectual property mentioned or depicted on this site. Such intellectual property remains the property of its respective owners, and any references here are made solely for identification or informational purposes, without implying any affiliation, endorsement, or partnership.
We make no representations or warranties, express or implied, regarding the accuracy, completeness, or suitability of any content or products presented. Nothing on this website should be construed as legal, tax, investment, financial, medical, or other professional advice. In addition, no part of this site—including articles or product references—constitutes a solicitation, recommendation, endorsement, advertisement, or offer to buy or sell any securities, franchises, or other financial instruments, particularly in jurisdictions where such activity would be unlawful.
All content is of a general nature and may not address the specific circumstances of any individual or entity. It is not a substitute for professional advice or services. Any actions you take based on the information provided here are strictly at your own risk. You accept full responsibility for any decisions or outcomes arising from your use of this website and agree to release us from any liability in connection with your use of, or reliance upon, the content or products found herein.