
|
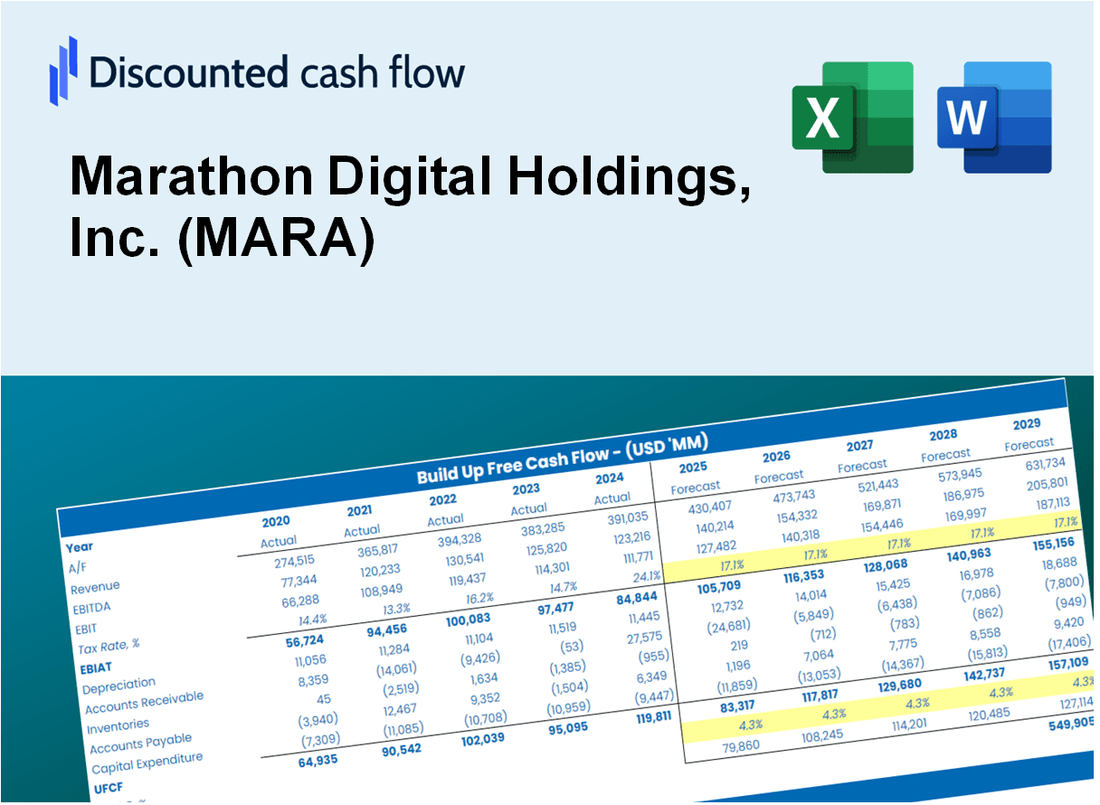
Valoración DCF de Marathon Digital Holdings, Inc. (MARA) |
Completamente Editable: Adáptelo A Sus Necesidades En Excel O Sheets
Diseño Profesional: Plantillas Confiables Y Estándares De La Industria
Predeterminadas Para Un Uso Rápido Y Eficiente
Compatible con MAC / PC, completamente desbloqueado
No Se Necesita Experiencia; Fáciles De Seguir
Marathon Digital Holdings, Inc. (MARA) Bundle
¡Descubra el verdadero potencial de Marathon Digital Holdings, Inc. (MARA) con nuestra calculadora DCF avanzada! Ajuste los supuestos críticos, explore varios escenarios y evalúe cómo las diferentes variables afectan la valoración de Marathon Digital Holdings, Inc. (MARA), todo dentro de una plantilla de Excel integral.
What You Will Receive
- Comprehensive Financial Model: Utilize Marathon Digital Holdings, Inc.'s ([MARA]) actual data for accurate DCF valuation.
- Full Forecasting Flexibility: Modify revenue growth, profit margins, WACC, and other essential drivers.
- Real-Time Calculations: Automatic updates provide immediate results as adjustments are made.
- Professional-Grade Template: A polished Excel file crafted for high-quality valuation presentations.
- Adaptable and Reusable: Designed for versatility, enabling repeated application for in-depth forecasts.
Key Features
- 🔍 Real-Life MARA Financials: Pre-filled historical and projected data for Marathon Digital Holdings, Inc. (MARA).
- ✏️ Fully Customizable Inputs: Adjust all critical parameters (yellow cells) such as WACC, growth %, and tax rates.
- 📊 Professional DCF Valuation: Built-in formulas calculate Marathon’s intrinsic value using the Discounted Cash Flow method.
- ⚡ Instant Results: Visualize Marathon’s valuation instantly after making changes.
- Scenario Analysis: Test and compare outcomes for various financial assumptions side-by-side.
How It Works
- Download: Obtain the pre-built Excel file containing Marathon Digital Holdings, Inc.'s (MARA) financial data.
- Customize: Modify forecasts such as revenue growth, EBITDA %, and WACC to fit your analysis.
- Update Automatically: Enjoy real-time updates for intrinsic value and NPV calculations.
- Test Scenarios: Generate various projections and instantly compare the results.
- Make Decisions: Utilize the valuation insights to inform your investment approach.
Why Choose This Calculator?
- Comprehensive Tool: Incorporates DCF, WACC, and financial ratio analyses tailored for Marathon Digital Holdings, Inc. (MARA).
- Customizable Inputs: Modify the yellow-highlighted cells to explore various financial scenarios.
- Detailed Insights: Automatically computes the intrinsic value and Net Present Value for Marathon Digital Holdings, Inc. (MARA).
- Preloaded Data: Historical and forecasted data provide reliable starting points for analysis.
- Professional Quality: Perfect for financial analysts, investors, and business consultants focused on Marathon Digital Holdings, Inc. (MARA).
Who Should Use This Product?
- Individual Investors: Make informed decisions about buying or selling Marathon Digital Holdings (MARA) stock.
- Financial Analysts: Streamline valuation processes with ready-to-use financial models for Marathon Digital Holdings (MARA).
- Consultants: Deliver professional valuation insights for Marathon Digital Holdings (MARA) to clients quickly and accurately.
- Business Owners: Understand how companies like Marathon Digital Holdings (MARA) are valued to guide your own strategy.
- Finance Students: Learn valuation techniques using real-world data and scenarios related to Marathon Digital Holdings (MARA).
What the Template Contains
- Historical Data: Includes Marathon Digital Holdings, Inc.'s (MARA) past financials and baseline forecasts.
- DCF and Levered DCF Models: Detailed templates to calculate Marathon's intrinsic value.
- WACC Sheet: Pre-built calculations for Weighted Average Cost of Capital.
- Editable Inputs: Modify key drivers like growth rates, EBITDA %, and CAPEX assumptions.
- Quarterly and Annual Statements: A complete breakdown of Marathon's financials.
- Interactive Dashboard: Visualize valuation results and projections dynamically.
Disclaimer
All information, articles, and product details provided on this website are for general informational and educational purposes only. We do not claim any ownership over, nor do we intend to infringe upon, any trademarks, copyrights, logos, brand names, or other intellectual property mentioned or depicted on this site. Such intellectual property remains the property of its respective owners, and any references here are made solely for identification or informational purposes, without implying any affiliation, endorsement, or partnership.
We make no representations or warranties, express or implied, regarding the accuracy, completeness, or suitability of any content or products presented. Nothing on this website should be construed as legal, tax, investment, financial, medical, or other professional advice. In addition, no part of this site—including articles or product references—constitutes a solicitation, recommendation, endorsement, advertisement, or offer to buy or sell any securities, franchises, or other financial instruments, particularly in jurisdictions where such activity would be unlawful.
All content is of a general nature and may not address the specific circumstances of any individual or entity. It is not a substitute for professional advice or services. Any actions you take based on the information provided here are strictly at your own risk. You accept full responsibility for any decisions or outcomes arising from your use of this website and agree to release us from any liability in connection with your use of, or reliance upon, the content or products found herein.