
|
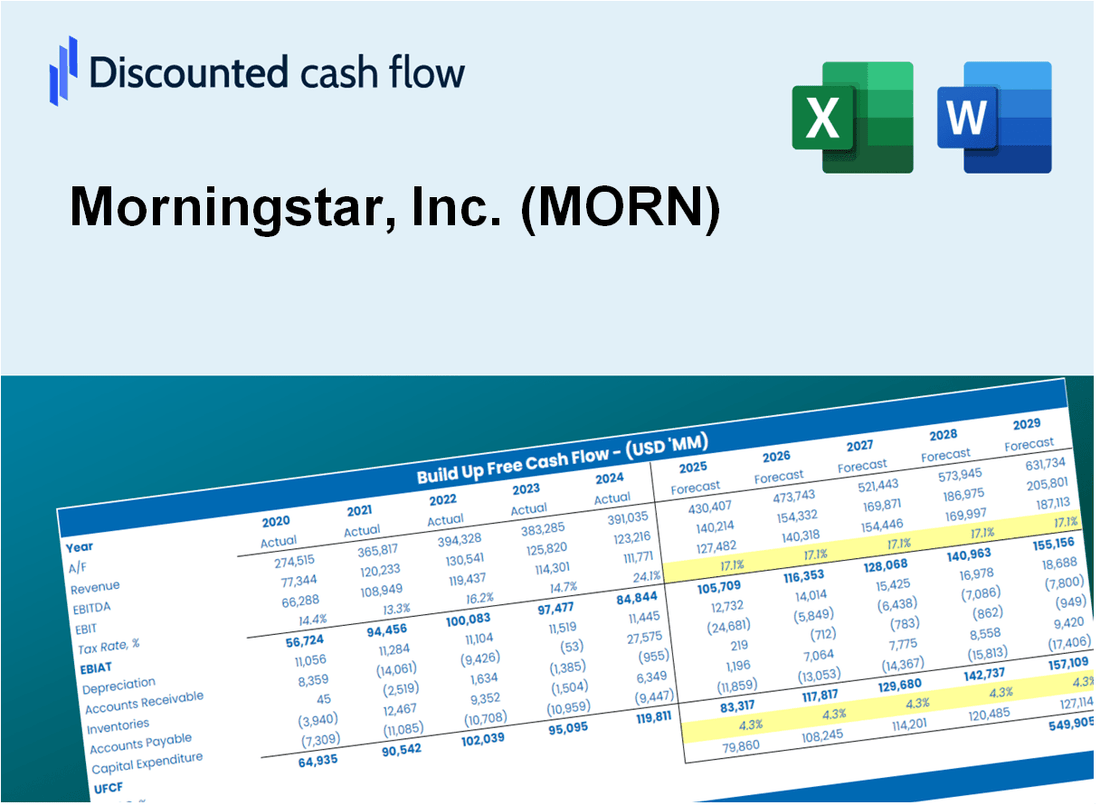
Valoración DCF de Morningstar, Inc. (MORN) |
Completamente Editable: Adáptelo A Sus Necesidades En Excel O Sheets
Diseño Profesional: Plantillas Confiables Y Estándares De La Industria
Predeterminadas Para Un Uso Rápido Y Eficiente
Compatible con MAC / PC, completamente desbloqueado
No Se Necesita Experiencia; Fáciles De Seguir
Morningstar, Inc. (MORN) Bundle
Ingementada para su precisión, nuestra calculadora DCF (por la mañana) le permite evaluar la valoración de Morningstar, Inc. utilizando datos financieros del mundo real, al tiempo que ofrece flexibilidad completa para modificar todos los parámetros esenciales para las proyecciones mejoradas.
Discounted Cash Flow (DCF) - (USD MM)
| Year | AY1 2020 |
AY2 2021 |
AY3 2022 |
AY4 2023 |
AY5 2024 |
FY1 2025 |
FY2 2026 |
FY3 2027 |
FY4 2028 |
FY5 2029 |
|---|---|---|---|---|---|---|---|---|---|---|
| Revenue | 1,389.5 | 1,699.3 | 1,870.6 | 2,038.6 | 2,275.1 | 2,576.3 | 2,917.4 | 3,303.7 | 3,741.1 | 4,236.4 |
| Revenue Growth, % | 0 | 22.3 | 10.08 | 8.98 | 11.6 | 13.24 | 13.24 | 13.24 | 13.24 | 13.24 |
| EBITDA | 354.7 | 407.7 | 327.3 | 427.1 | 714.2 | 615.0 | 696.4 | 788.6 | 893.1 | 1,011.3 |
| EBITDA, % | 25.53 | 23.99 | 17.5 | 20.95 | 31.39 | 23.87 | 23.87 | 23.87 | 23.87 | 23.87 |
| Depreciation | 139.5 | 150.7 | 166.6 | 184.9 | 190.4 | 233.2 | 264.0 | 299.0 | 338.6 | 383.4 |
| Depreciation, % | 10.04 | 8.87 | 8.91 | 9.07 | 8.37 | 9.05 | 9.05 | 9.05 | 9.05 | 9.05 |
| EBIT | 215.2 | 257.0 | 160.7 | 242.2 | 523.8 | 381.8 | 432.4 | 489.6 | 554.5 | 627.9 |
| EBIT, % | 15.49 | 15.12 | 8.59 | 11.88 | 23.02 | 14.82 | 14.82 | 14.82 | 14.82 | 14.82 |
| Total Cash | 464.2 | 546.1 | 414.6 | 389.0 | 551.0 | 675.0 | 764.4 | 865.6 | 980.2 | 1,110.0 |
| Total Cash, percent | .0 | .0 | .0 | .0 | .0 | .0 | .0 | .0 | .0 | .0 |
| Account Receivables | 207.3 | 277.8 | 307.9 | 344.5 | 370.5 | 416.9 | 472.1 | 534.6 | 605.4 | 685.5 |
| Account Receivables, % | 14.92 | 16.35 | 16.46 | 16.9 | 16.28 | 16.18 | 16.18 | 16.18 | 16.18 | 16.18 |
| Inventories | .0 | .0 | .0 | .0 | .0 | .0 | .0 | .0 | .0 | .0 |
| Inventories, % | 0 | 0 | 0 | 0 | 0 | 0 | 0 | 0 | 0 | 0 |
| Accounts Payable | .0 | .0 | .0 | 78.4 | 87.3 | 39.6 | 44.8 | 50.8 | 57.5 | 65.1 |
| Accounts Payable, % | 0 | 0 | 0 | 3.85 | 3.84 | 1.54 | 1.54 | 1.54 | 1.54 | 1.54 |
| Capital Expenditure | -76.7 | -101.8 | -129.5 | -119.1 | -142.7 | -157.4 | -178.2 | -201.8 | -228.6 | -258.8 |
| Capital Expenditure, % | -5.52 | -5.99 | -6.92 | -5.84 | -6.27 | -6.11 | -6.11 | -6.11 | -6.11 | -6.11 |
| Tax Rate, % | 21.95 | 21.95 | 21.95 | 21.95 | 21.95 | 21.95 | 21.95 | 21.95 | 21.95 | 21.95 |
| EBITAT | 169.9 | 194.1 | 89.2 | 196.3 | 408.8 | 281.9 | 319.2 | 361.4 | 409.3 | 463.5 |
| Depreciation | ||||||||||
| Changes in Account Receivables | ||||||||||
| Changes in Inventories | ||||||||||
| Changes in Accounts Payable | ||||||||||
| Capital Expenditure | ||||||||||
| UFCF | 25.4 | 172.5 | 96.2 | 303.9 | 439.4 | 263.5 | 355.0 | 402.0 | 455.2 | 515.5 |
| WACC, % | 8.57 | 8.55 | 8.46 | 8.58 | 8.57 | 8.55 | 8.55 | 8.55 | 8.55 | 8.55 |
| PV UFCF | ||||||||||
| SUM PV UFCF | 1,528.5 | |||||||||
| Long Term Growth Rate, % | 2.00 | |||||||||
| Free cash flow (T + 1) | 526 | |||||||||
| Terminal Value | 8,033 | |||||||||
| Present Terminal Value | 5,331 | |||||||||
| Enterprise Value | 6,859 | |||||||||
| Net Debt | 401 | |||||||||
| Equity Value | 6,458 | |||||||||
| Diluted Shares Outstanding, MM | 43 | |||||||||
| Equity Value Per Share | 149.84 |
What You Will Get
- Comprehensive MORN Financials: Access to historical and projected data for precise valuation.
- Customizable Inputs: Adjust WACC, tax rates, revenue growth, and capital expenditures to fit your analysis.
- Real-Time Calculations: Intrinsic value and NPV are computed automatically.
- Scenario Planning: Evaluate various scenarios to assess Morningstar’s potential future performance.
- User-Friendly Interface: Designed for professionals while remaining approachable for newcomers.
Key Features
- Comprehensive MORN Data: Pre-filled with Morningstar’s historical performance metrics and future projections.
- Fully Customizable Parameters: Tailor growth rates, profit margins, discount rates, tax implications, and capital investments.
- Interactive Valuation Model: Instant updates to Net Present Value (NPV) and intrinsic value based on user inputs.
- Scenario Analysis: Develop various forecasting scenarios to evaluate different valuation results.
- User-Centric Interface: Intuitive, organized, and crafted for both seasoned professionals and newcomers.
How It Works
- 1. Access the Model: Download and open the Excel file containing Morningstar, Inc.'s (MORN) financial data.
- 2. Adjust Key Variables: Modify essential inputs such as revenue growth, discount rates, and operating expenses.
- 3. Analyze Results Immediately: The DCF model automatically computes the fair value and net present value.
- 4. Explore Different Scenarios: Evaluate various projections to understand diverse valuation results.
- 5. Present with Assurance: Share professional valuation analyses to enhance your strategic decisions.
Why Choose This Calculator?
- Designed for Investors: A sophisticated tool tailored for portfolio managers, analysts, and individual investors.
- Comprehensive Data: Morningstar’s extensive historical and projected financials preloaded for precision.
- Investment Scenarios: Easily simulate various market conditions and investment strategies.
- Insightful Outputs: Automatically calculates fair value, risk metrics, and essential ratios.
- User-Friendly: Intuitive interface with step-by-step guidance throughout the calculations.
Who Should Use Morningstar, Inc. (MORN)?
- Investors: Gain insights and make informed decisions with comprehensive investment research tools.
- Financial Analysts: Streamline your analysis with robust data and customizable reporting options.
- Advisors: Enhance client portfolios by leveraging detailed market data and analysis.
- Finance Enthusiasts: Expand your knowledge of investment strategies and market trends through expert insights.
- Educators and Students: Utilize it as a valuable resource for finance education and practical applications.
What the Template Contains
- Pre-Filled Data: Contains Morningstar’s historical financials and projections.
- Discounted Cash Flow Model: Customizable DCF valuation model with automatic calculations.
- Weighted Average Cost of Capital (WACC): A dedicated sheet for computing WACC based on user-defined inputs.
- Key Financial Ratios: Evaluate Morningstar’s profitability, efficiency, and financial leverage.
- Customizable Inputs: Easily modify revenue growth, profit margins, and tax rates.
- Clear Dashboard: Visual representations and tables summarizing essential valuation outcomes.
Disclaimer
All information, articles, and product details provided on this website are for general informational and educational purposes only. We do not claim any ownership over, nor do we intend to infringe upon, any trademarks, copyrights, logos, brand names, or other intellectual property mentioned or depicted on this site. Such intellectual property remains the property of its respective owners, and any references here are made solely for identification or informational purposes, without implying any affiliation, endorsement, or partnership.
We make no representations or warranties, express or implied, regarding the accuracy, completeness, or suitability of any content or products presented. Nothing on this website should be construed as legal, tax, investment, financial, medical, or other professional advice. In addition, no part of this site—including articles or product references—constitutes a solicitation, recommendation, endorsement, advertisement, or offer to buy or sell any securities, franchises, or other financial instruments, particularly in jurisdictions where such activity would be unlawful.
All content is of a general nature and may not address the specific circumstances of any individual or entity. It is not a substitute for professional advice or services. Any actions you take based on the information provided here are strictly at your own risk. You accept full responsibility for any decisions or outcomes arising from your use of this website and agree to release us from any liability in connection with your use of, or reliance upon, the content or products found herein.