
|
Valoración DCF de Mid Penn Bancorp, Inc. (MPB) |
Completamente Editable: Adáptelo A Sus Necesidades En Excel O Sheets
Diseño Profesional: Plantillas Confiables Y Estándares De La Industria
Predeterminadas Para Un Uso Rápido Y Eficiente
Compatible con MAC / PC, completamente desbloqueado
No Se Necesita Experiencia; Fáciles De Seguir
Mid Penn Bancorp, Inc. (MPB) Bundle
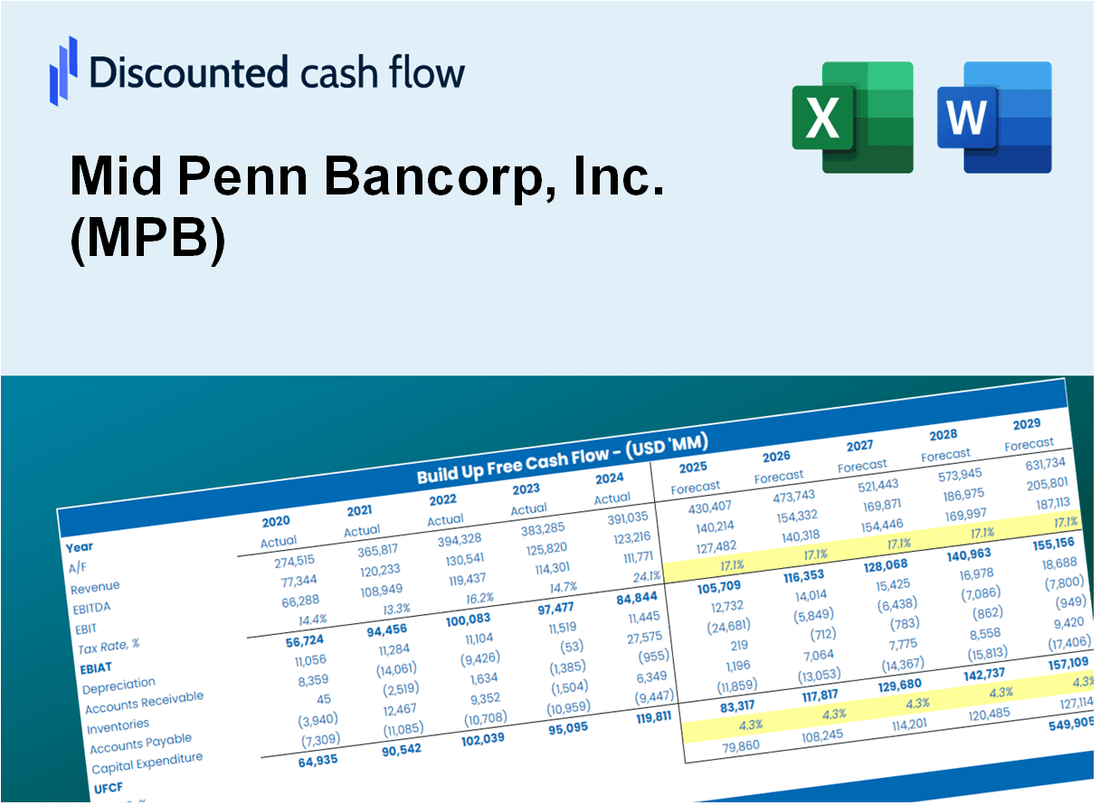
Como inversor o analista, esta calculadora DCF (MPB) es su recurso de referencia para una valoración precisa. Con datos reales de Mid Penn Bancorp, Inc., puede ajustar fácilmente los pronósticos y observar instantáneamente los efectos.
Discounted Cash Flow (DCF) - (USD MM)
| Year | AY1 2020 |
AY2 2021 |
AY3 2022 |
AY4 2023 |
AY5 2024 |
FY1 2025 |
FY2 2026 |
FY3 2027 |
FY4 2028 |
FY5 2029 |
|---|---|---|---|---|---|---|---|---|---|---|
| Revenue | 122.7 | 143.8 | 187.3 | 254.4 | 177.6 | 201.2 | 228.0 | 258.2 | 292.5 | 331.3 |
| Revenue Growth, % | 0 | 17.23 | 30.19 | 35.85 | -30.17 | 13.28 | 13.28 | 13.28 | 13.28 | 13.28 |
| EBITDA | 37.8 | 40.7 | 73.8 | 51.6 | 66.9 | 63.0 | 71.3 | 80.8 | 91.5 | 103.7 |
| EBITDA, % | 30.8 | 28.32 | 39.42 | 20.27 | 37.64 | 31.29 | 31.29 | 31.29 | 31.29 | 31.29 |
| Depreciation | 6.5 | 4.7 | 6.5 | 6.9 | 6.8 | 7.4 | 8.4 | 9.6 | 10.8 | 12.3 |
| Depreciation, % | 5.26 | 3.25 | 3.46 | 2.7 | 3.84 | 3.7 | 3.7 | 3.7 | 3.7 | 3.7 |
| EBIT | 31.3 | 36.1 | 67.3 | 44.7 | 60.0 | 55.5 | 62.9 | 71.2 | 80.7 | 91.4 |
| EBIT, % | 25.54 | 25.07 | 35.97 | 17.57 | 33.79 | 27.59 | 27.59 | 27.59 | 27.59 | 27.59 |
| Total Cash | 39.1 | 250.5 | 296.1 | 303.7 | 312.0 | 173.8 | 196.9 | 223.0 | 252.6 | 286.2 |
| Total Cash, percent | .0 | .0 | .0 | .0 | .0 | .0 | .0 | .0 | .0 | .0 |
| Account Receivables | 13.0 | 11.3 | 18.4 | 25.8 | 26.8 | 21.5 | 24.4 | 27.6 | 31.3 | 35.5 |
| Account Receivables, % | 10.57 | 7.88 | 9.83 | 10.15 | 15.11 | 10.71 | 10.71 | 10.71 | 10.71 | 10.71 |
| Inventories | .0 | .0 | .0 | .0 | .0 | .0 | .0 | .0 | .0 | .0 |
| Inventories, % | 0 | 0 | 0 | 0 | 0 | 0 | 0 | 0 | 0 | 0 |
| Accounts Payable | 2.0 | 1.8 | 2.3 | 14.3 | 13.5 | 7.0 | 7.9 | 8.9 | 10.1 | 11.5 |
| Accounts Payable, % | 1.64 | 1.25 | 1.23 | 5.6 | 7.59 | 3.46 | 3.46 | 3.46 | 3.46 | 3.46 |
| Capital Expenditure | -3.7 | -3.5 | -4.2 | -2.8 | -6.9 | -5.1 | -5.8 | -6.6 | -7.4 | -8.4 |
| Capital Expenditure, % | -3 | -2.43 | -2.27 | -1.09 | -3.89 | -2.54 | -2.54 | -2.54 | -2.54 | -2.54 |
| Tax Rate, % | 17.65 | 17.65 | 17.65 | 17.65 | 17.65 | 17.65 | 17.65 | 17.65 | 17.65 | 17.65 |
| EBITAT | 26.2 | 29.3 | 54.8 | 37.4 | 49.4 | 45.8 | 51.9 | 58.8 | 66.6 | 75.4 |
| Depreciation | ||||||||||
| Changes in Account Receivables | ||||||||||
| Changes in Inventories | ||||||||||
| Changes in Accounts Payable | ||||||||||
| Capital Expenditure | ||||||||||
| UFCF | 18.0 | 31.9 | 50.5 | 46.0 | 47.6 | 46.9 | 52.6 | 59.6 | 67.5 | 76.4 |
| WACC, % | 24.14 | 23.62 | 23.63 | 24.15 | 23.85 | 23.88 | 23.88 | 23.88 | 23.88 | 23.88 |
| PV UFCF | ||||||||||
| SUM PV UFCF | 158.3 | |||||||||
| Long Term Growth Rate, % | 2.00 | |||||||||
| Free cash flow (T + 1) | 78 | |||||||||
| Terminal Value | 356 | |||||||||
| Present Terminal Value | 122 | |||||||||
| Enterprise Value | 280 | |||||||||
| Net Debt | 28 | |||||||||
| Equity Value | 253 | |||||||||
| Diluted Shares Outstanding, MM | 17 | |||||||||
| Equity Value Per Share | 14.79 |
What You Will Get
- Editable Forecast Inputs: Easily modify assumptions (growth %, margins, WACC) to explore various scenarios.
- Real-World Data: Mid Penn Bancorp’s (MPB) financial data pre-loaded to kickstart your analysis.
- Automatic DCF Outputs: The template computes Net Present Value (NPV) and intrinsic value for you.
- Customizable and Professional: A refined Excel model that adjusts to your valuation requirements.
- Built for Analysts and Investors: Perfect for evaluating projections, confirming strategies, and enhancing efficiency.
Key Features
- Accurate Mid Penn Financials: Access reliable pre-loaded historical data and future projections for Mid Penn Bancorp, Inc. (MPB).
- Customizable Forecast Assumptions: Modify highlighted cells for key metrics such as WACC, growth rates, and profit margins.
- Dynamic Calculations: Automatic updates for DCF, Net Present Value (NPV), and cash flow analysis.
- Visual Dashboard: User-friendly charts and summaries to help visualize your valuation results.
- For All Skill Levels: An intuitive design tailored for investors, CFOs, and financial consultants.
How It Works
- Step 1: Download the Excel file for Mid Penn Bancorp, Inc. (MPB).
- Step 2: Review the pre-filled financial data and forecasts for Mid Penn Bancorp, Inc. (MPB).
- Step 3: Adjust key inputs such as revenue growth, WACC, and tax rates (highlighted cells).
- Step 4: Observe the DCF model updating in real-time as you modify your assumptions.
- Step 5: Evaluate the outputs and leverage the results for your investment strategies.
Why Choose Mid Penn Bancorp, Inc. (MPB)?
- Time Efficiency: Quickly access essential banking services without unnecessary delays.
- Enhanced Accuracy: Utilize reliable financial products that minimize errors in your transactions.
- Customizable Solutions: Adapt our services to meet your unique financial needs and goals.
- User-Friendly Experience: Intuitive interfaces and clear information make banking straightforward.
- Endorsed by Professionals: Trusted by financial experts for our commitment to quality and customer satisfaction.
Who Should Use This Product?
- Investors: Accurately assess Mid Penn Bancorp's fair value before making investment choices.
- CFOs: Utilize a professional-grade DCF model for financial analysis and reporting.
- Consultants: Efficiently customize the template for client valuation reports.
- Entrepreneurs: Acquire insights into financial modeling practices employed by leading banks.
- Educators: Implement it as a teaching resource to illustrate valuation techniques.
What the Template Contains
- Pre-Filled Data: Includes Mid Penn Bancorp, Inc.’s (MPB) historical financials and forecasts.
- Discounted Cash Flow Model: Editable DCF valuation model with automatic calculations.
- Weighted Average Cost of Capital (WACC): A dedicated sheet for calculating WACC based on custom inputs.
- Key Financial Ratios: Analyze Mid Penn Bancorp, Inc.’s (MPB) profitability, efficiency, and leverage.
- Customizable Inputs: Edit revenue growth, margins, and tax rates with ease.
- Clear Dashboard: Charts and tables summarizing key valuation results.
Disclaimer
All information, articles, and product details provided on this website are for general informational and educational purposes only. We do not claim any ownership over, nor do we intend to infringe upon, any trademarks, copyrights, logos, brand names, or other intellectual property mentioned or depicted on this site. Such intellectual property remains the property of its respective owners, and any references here are made solely for identification or informational purposes, without implying any affiliation, endorsement, or partnership.
We make no representations or warranties, express or implied, regarding the accuracy, completeness, or suitability of any content or products presented. Nothing on this website should be construed as legal, tax, investment, financial, medical, or other professional advice. In addition, no part of this site—including articles or product references—constitutes a solicitation, recommendation, endorsement, advertisement, or offer to buy or sell any securities, franchises, or other financial instruments, particularly in jurisdictions where such activity would be unlawful.
All content is of a general nature and may not address the specific circumstances of any individual or entity. It is not a substitute for professional advice or services. Any actions you take based on the information provided here are strictly at your own risk. You accept full responsibility for any decisions or outcomes arising from your use of this website and agree to release us from any liability in connection with your use of, or reliance upon, the content or products found herein.