
|
Marshalls PLC (MSLH.L) Valoración de DCF |
Completamente Editable: Adáptelo A Sus Necesidades En Excel O Sheets
Diseño Profesional: Plantillas Confiables Y Estándares De La Industria
Predeterminadas Para Un Uso Rápido Y Eficiente
Compatible con MAC / PC, completamente desbloqueado
No Se Necesita Experiencia; Fáciles De Seguir
Marshalls plc (MSLH.L) Bundle
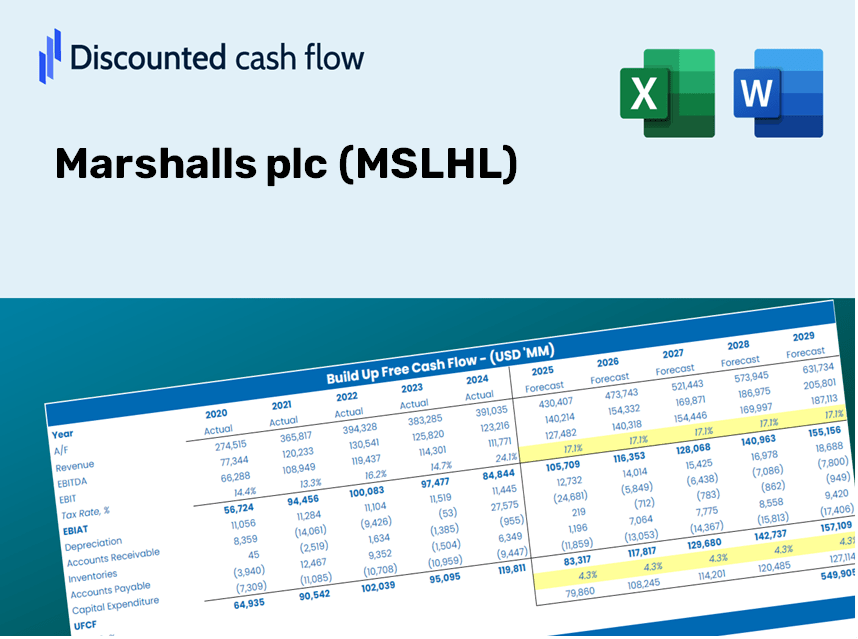
Engerrado para la precisión, nuestra calculadora DCF Marshalls PLC (MSLHL) le permite evaluar la valoración de la Compañía utilizando datos financieros de la vida real, proporcionando una flexibilidad completa para modificar todos los parámetros esenciales para las proyecciones mejoradas.
Discounted Cash Flow (DCF) - (USD MM)
| Year | AY1 2020 |
AY2 2021 |
AY3 2022 |
AY4 2023 |
AY5 2024 |
FY1 2025 |
FY2 2026 |
FY3 2027 |
FY4 2028 |
FY5 2029 |
|---|---|---|---|---|---|---|---|---|---|---|
| Revenue | 469.5 | 589.3 | 719.4 | 671.2 | 619.2 | 670.5 | 726.1 | 786.3 | 851.5 | 922.1 |
| Revenue Growth, % | 0 | 25.52 | 22.08 | -6.7 | -7.75 | 8.29 | 8.29 | 8.29 | 8.29 | 8.29 |
| EBITDA | 39.7 | 103.9 | 90.1 | 84.3 | 84.2 | 86.8 | 94.0 | 101.8 | 110.3 | 119.4 |
| EBITDA, % | 8.45 | 17.63 | 12.52 | 12.56 | 13.6 | 12.95 | 12.95 | 12.95 | 12.95 | 12.95 |
| Depreciation | 30.4 | 30.9 | 42.3 | 43.3 | 32.5 | 39.3 | 42.6 | 46.1 | 49.9 | 54.0 |
| Depreciation, % | 6.48 | 5.25 | 5.88 | 6.45 | 5.25 | 5.86 | 5.86 | 5.86 | 5.86 | 5.86 |
| EBIT | 9.2 | 73.0 | 47.8 | 41.0 | 51.7 | 47.5 | 51.5 | 55.8 | 60.4 | 65.4 |
| EBIT, % | 1.97 | 12.38 | 6.65 | 6.11 | 8.35 | 7.09 | 7.09 | 7.09 | 7.09 | 7.09 |
| Total Cash | 103.7 | 41.2 | 56.3 | 34.5 | 18.9 | 60.5 | 65.5 | 70.9 | 76.8 | 83.2 |
| Total Cash, percent | .0 | .0 | .0 | .0 | .0 | .0 | .0 | .0 | .0 | .0 |
| Account Receivables | 95.7 | 111.9 | 123.3 | 95.1 | 80.8 | 112.3 | 121.6 | 131.7 | 142.6 | 154.4 |
| Account Receivables, % | 20.39 | 18.99 | 17.14 | 14.17 | 13.05 | 16.75 | 16.75 | 16.75 | 16.75 | 16.75 |
| Inventories | 89.8 | 107.4 | 138.8 | 125.1 | 138.2 | 130.9 | 141.7 | 153.5 | 166.2 | 180.0 |
| Inventories, % | 19.12 | 18.23 | 19.29 | 18.64 | 22.32 | 19.52 | 19.52 | 19.52 | 19.52 | 19.52 |
| Accounts Payable | 59.3 | 67.3 | 82.6 | 59.3 | 72.5 | 75.2 | 81.4 | 88.2 | 95.5 | 103.4 |
| Accounts Payable, % | 12.63 | 11.41 | 11.48 | 8.83 | 11.71 | 11.21 | 11.21 | 11.21 | 11.21 | 11.21 |
| Capital Expenditure | -14.8 | -21.9 | -30.2 | -20.8 | -9.2 | -21.0 | -22.7 | -24.6 | -26.6 | -28.8 |
| Capital Expenditure, % | -3.14 | -3.72 | -4.19 | -3.1 | -1.49 | -3.13 | -3.13 | -3.13 | -3.13 | -3.13 |
| Tax Rate, % | 21.32 | 21.32 | 21.32 | 21.32 | 21.32 | 21.32 | 21.32 | 21.32 | 21.32 | 21.32 |
| EBITAT | 4.7 | 57.7 | 34.5 | 34.4 | 40.7 | 34.7 | 37.5 | 40.6 | 44.0 | 47.7 |
| Depreciation | ||||||||||
| Changes in Account Receivables | ||||||||||
| Changes in Inventories | ||||||||||
| Changes in Accounts Payable | ||||||||||
| Capital Expenditure | ||||||||||
| UFCF | -105.9 | 40.8 | 19.2 | 75.4 | 78.4 | 31.5 | 43.5 | 47.1 | 51.0 | 55.2 |
| WACC, % | 8.26 | 8.93 | 8.76 | 9.04 | 8.92 | 8.78 | 8.78 | 8.78 | 8.78 | 8.78 |
| PV UFCF | ||||||||||
| SUM PV UFCF | 174.8 | |||||||||
| Long Term Growth Rate, % | 3.50 | |||||||||
| Free cash flow (T + 1) | 57 | |||||||||
| Terminal Value | 1,081 | |||||||||
| Present Terminal Value | 710 | |||||||||
| Enterprise Value | 884 | |||||||||
| Net Debt | 169 | |||||||||
| Equity Value | 715 | |||||||||
| Diluted Shares Outstanding, MM | 254 | |||||||||
| Equity Value Per Share | 281.76 |
What You Will Receive
- Genuine Marshalls Data: Preloaded financial details – from revenue to EBIT – derived from actual and projected figures.
- Complete Customization: Modify all key parameters (yellow cells) such as WACC, growth %, and tax rates.
- Immediate Valuation Updates: Automatic recalculations to assess the impact of changes on Marshalls' fair value.
- Flexible Excel Template: Designed for quick modifications, scenario simulations, and comprehensive projections.
- Efficient and Precise: Avoid the hassle of building models from scratch while ensuring accuracy and adaptability.
Key Features
- 🔍 Real-Life MSLHL Financials: Pre-filled historical and projected data for Marshalls plc.
- ✏️ Fully Customizable Inputs: Adjust all critical parameters (yellow cells) such as WACC, growth %, and tax rates.
- 📊 Professional DCF Valuation: Built-in formulas calculate Marshalls’ intrinsic value using the Discounted Cash Flow method.
- ⚡ Instant Results: Visualize Marshalls’ valuation immediately after making changes.
- Scenario Analysis: Test and compare outcomes for various financial assumptions side-by-side.
How It Works
- Step 1: Download the Excel file.
- Step 2: Examine the pre-filled data for Marshalls plc (MSLHL), including both historical and forecasted figures.
- Step 3: Modify the key assumptions (in yellow cells) based on your insights and analysis.
- Step 4: Observe the automatic recalculations reflecting Marshalls plc's (MSLHL) intrinsic value.
- Step 5: Utilize the results for your investment strategies or reporting needs.
Why Opt for Marshalls plc (MSLHL) Calculator?
- Precision: Utilizes actual financial data from Marshalls plc for optimal accuracy.
- Versatility: Tailored for users to easily experiment and adjust various inputs.
- Efficiency: Avoid the complexity of constructing a DCF model from the ground up.
- Expert-Level: Crafted with the expertise and usability requirements of CFOs in mind.
- Intuitive: Simple to navigate, suitable for users without advanced financial modeling skills.
Who Should Utilize Marshalls plc (MSLHL)?
- Professional Investors: Develop comprehensive and accurate valuation models for portfolio assessments.
- Corporate Finance Teams: Evaluate valuation scenarios to inform internal strategic decisions.
- Consultants and Advisors: Offer clients precise valuation insights regarding Marshalls plc (MSLHL).
- Students and Educators: Leverage real-world data to practice and instruct on financial modeling techniques.
- Construction and Design Enthusiasts: Gain insights into how companies like Marshalls plc (MSLHL) are valued within the industry.
Contents of the Template
- Pre-Filled DCF Model: Marshalls plc’s financial data ready for immediate analysis.
- WACC Calculator: Comprehensive calculations for Weighted Average Cost of Capital.
- Financial Ratios: Assess Marshalls plc’s profitability, leverage, and efficiency metrics.
- Editable Inputs: Customize assumptions such as growth rates, margins, and CAPEX to suit your needs.
- Financial Statements: Access annual and quarterly reports for in-depth evaluation.
- Interactive Dashboard: Effortlessly visualize essential valuation metrics and outcomes.
Disclaimer
All information, articles, and product details provided on this website are for general informational and educational purposes only. We do not claim any ownership over, nor do we intend to infringe upon, any trademarks, copyrights, logos, brand names, or other intellectual property mentioned or depicted on this site. Such intellectual property remains the property of its respective owners, and any references here are made solely for identification or informational purposes, without implying any affiliation, endorsement, or partnership.
We make no representations or warranties, express or implied, regarding the accuracy, completeness, or suitability of any content or products presented. Nothing on this website should be construed as legal, tax, investment, financial, medical, or other professional advice. In addition, no part of this site—including articles or product references—constitutes a solicitation, recommendation, endorsement, advertisement, or offer to buy or sell any securities, franchises, or other financial instruments, particularly in jurisdictions where such activity would be unlawful.
All content is of a general nature and may not address the specific circumstances of any individual or entity. It is not a substitute for professional advice or services. Any actions you take based on the information provided here are strictly at your own risk. You accept full responsibility for any decisions or outcomes arising from your use of this website and agree to release us from any liability in connection with your use of, or reliance upon, the content or products found herein.