
|
Valoración DCF de Matador Resources Company (MTDR) |
Completamente Editable: Adáptelo A Sus Necesidades En Excel O Sheets
Diseño Profesional: Plantillas Confiables Y Estándares De La Industria
Predeterminadas Para Un Uso Rápido Y Eficiente
Compatible con MAC / PC, completamente desbloqueado
No Se Necesita Experiencia; Fáciles De Seguir
Matador Resources Company (MTDR) Bundle
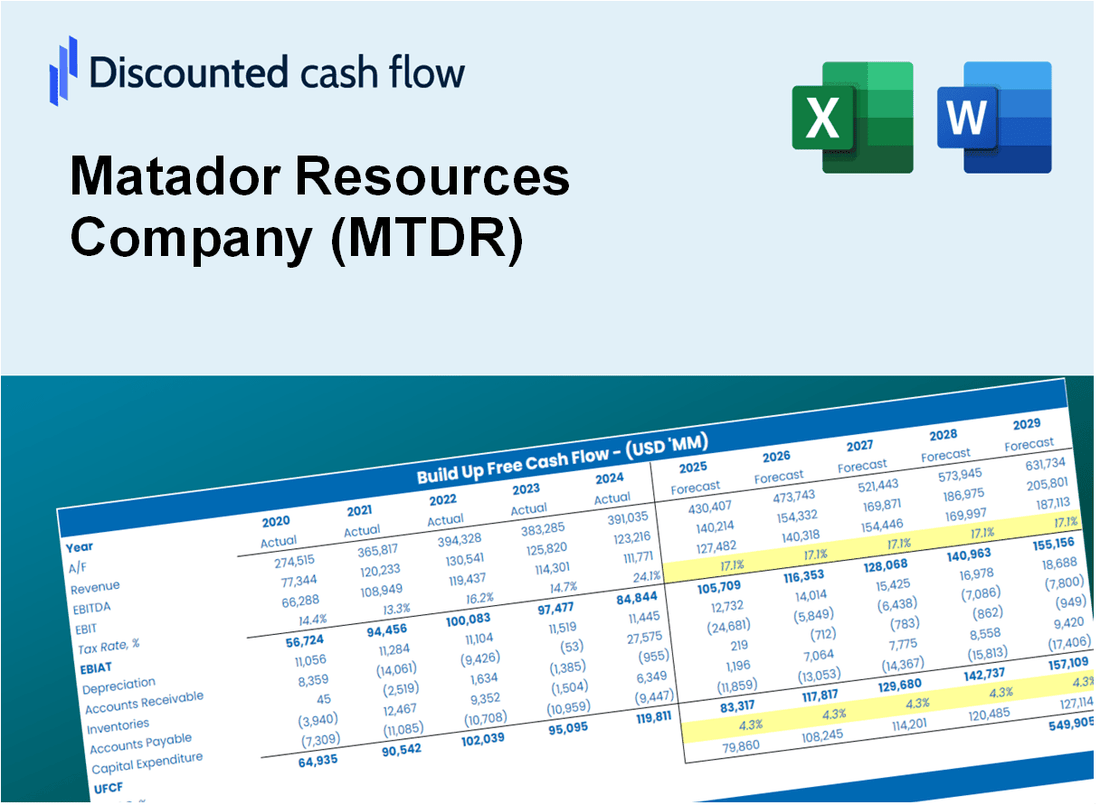
Diseñada para la precisión, nuestra calculadora DCF (MTDR) le permite evaluar la valoración de la compañía de recursos de Matador utilizando información financiera del mundo real, al tiempo que ofrece una flexibilidad completa para modificar todos los parámetros esenciales para las proyecciones mejoradas.
Discounted Cash Flow (DCF) - (USD MM)
| Year | AY1 2020 |
AY2 2021 |
AY3 2022 |
AY4 2023 |
AY5 2024 |
FY1 2025 |
FY2 2026 |
FY3 2027 |
FY4 2028 |
FY5 2029 |
|---|---|---|---|---|---|---|---|---|---|---|
| Revenue | 862.1 | 1,663.0 | 3,058.0 | 2,817.6 | 3,479.0 | 5,152.3 | 7,630.4 | 11,300.4 | 16,735.7 | 24,785.2 |
| Revenue Growth, % | 0 | 92.89 | 83.89 | -7.86 | 23.47 | 48.1 | 48.1 | 48.1 | 48.1 | 48.1 |
| EBITDA | -353.7 | 1,140.0 | 2,228.0 | 1,938.5 | 2,415.7 | 2,459.0 | 3,641.7 | 5,393.2 | 7,987.3 | 11,829.0 |
| EBITDA, % | -41.02 | 68.55 | 72.86 | 68.8 | 69.44 | 47.73 | 47.73 | 47.73 | 47.73 | 47.73 |
| Depreciation | 363.8 | 347.0 | 468.8 | 720.6 | 974.3 | 1,359.9 | 2,014.0 | 2,982.7 | 4,417.2 | 6,541.8 |
| Depreciation, % | 42.2 | 20.86 | 15.33 | 25.58 | 28.01 | 26.39 | 26.39 | 26.39 | 26.39 | 26.39 |
| EBIT | -717.4 | 793.1 | 1,759.3 | 1,217.9 | 1,441.4 | 1,099.1 | 1,627.7 | 2,410.6 | 3,570.0 | 5,287.1 |
| EBIT, % | -83.22 | 47.69 | 57.53 | 43.22 | 41.43 | 21.33 | 21.33 | 21.33 | 21.33 | 21.33 |
| Total Cash | 57.9 | 48.1 | 505.2 | 52.7 | 23.0 | 295.4 | 437.4 | 647.8 | 959.4 | 1,420.8 |
| Total Cash, percent | .0 | .0 | .0 | .0 | .0 | .0 | .0 | .0 | .0 | .0 |
| Account Receivables | 137.1 | 241.4 | 453.8 | 473.0 | 654.7 | 833.3 | 1,234.1 | 1,827.7 | 2,706.8 | 4,008.7 |
| Account Receivables, % | 15.91 | 14.52 | 14.84 | 16.79 | 18.82 | 16.17 | 16.17 | 16.17 | 16.17 | 16.17 |
| Inventories | 10.6 | 12.2 | 15.2 | 41.8 | 38.5 | 52.0 | 77.0 | 114.1 | 168.9 | 250.2 |
| Inventories, % | 1.23 | 0.7329 | 0.49653 | 1.48 | 1.11 | 1.01 | 1.01 | 1.01 | 1.01 | 1.01 |
| Accounts Payable | 14.0 | 26.3 | 58.8 | 68.2 | 147.1 | 121.3 | 179.7 | 266.1 | 394.1 | 583.7 |
| Accounts Payable, % | 1.62 | 1.58 | 1.92 | 2.42 | 4.23 | 2.35 | 2.35 | 2.35 | 2.35 | 2.35 |
| Capital Expenditure | -780.5 | -733.5 | -1,084.0 | -1,549.8 | -1,966.8 | -2,902.0 | -4,297.7 | -6,364.9 | -9,426.2 | -13,960.0 |
| Capital Expenditure, % | -90.53 | -44.11 | -35.45 | -55 | -56.54 | -56.32 | -56.32 | -56.32 | -56.32 | -56.32 |
| Tax Rate, % | 29.94 | 29.94 | 29.94 | 29.94 | 29.94 | 29.94 | 29.94 | 29.94 | 29.94 | 29.94 |
| EBITAT | -662.8 | 648.5 | 1,267.2 | 939.9 | 1,009.8 | 864.8 | 1,280.7 | 1,896.7 | 2,809.0 | 4,160.1 |
| Depreciation | ||||||||||
| Changes in Account Receivables | ||||||||||
| Changes in Inventories | ||||||||||
| Changes in Accounts Payable | ||||||||||
| Capital Expenditure | ||||||||||
| UFCF | -1,213.3 | 168.4 | 469.2 | 74.2 | -82.2 | -895.2 | -1,370.5 | -2,029.7 | -3,005.9 | -4,451.6 |
| WACC, % | 8.56 | 8.31 | 8.08 | 8.2 | 8.03 | 8.24 | 8.24 | 8.24 | 8.24 | 8.24 |
| PV UFCF | ||||||||||
| SUM PV UFCF | -8,784.3 | |||||||||
| Long Term Growth Rate, % | 0.50 | |||||||||
| Free cash flow (T + 1) | -4,474 | |||||||||
| Terminal Value | -57,824 | |||||||||
| Present Terminal Value | -38,925 | |||||||||
| Enterprise Value | -47,709 | |||||||||
| Net Debt | 2,092 | |||||||||
| Equity Value | -49,801 | |||||||||
| Diluted Shares Outstanding, MM | 124 | |||||||||
| Equity Value Per Share | -401.38 |
What You Will Receive
- Adjustable Forecast Inputs: Effortlessly modify assumptions (growth %, margins, WACC) to explore various scenarios.
- Comprehensive Data: Matador Resources Company’s (MTDR) financial data pre-filled to kickstart your analysis.
- Automated DCF Outputs: The template computes Net Present Value (NPV) and intrinsic value automatically for you.
- Tailored and Professional: A refined Excel model that caters to your valuation requirements.
- Designed for Analysts and Investors: Perfect for evaluating projections, confirming strategies, and enhancing efficiency.
Key Features
- 🔍 Real-Life MTDR Financials: Pre-filled historical and projected data for Matador Resources Company (MTDR).
- ✏️ Fully Customizable Inputs: Adjust all critical parameters (yellow cells) like WACC, growth %, and tax rates.
- 📊 Professional DCF Valuation: Built-in formulas calculate Matador's intrinsic value using the Discounted Cash Flow method.
- ⚡ Instant Results: Visualize Matador's valuation instantly after making changes.
- Scenario Analysis: Test and compare outcomes for various financial assumptions side-by-side.
How It Works
- Download the Template: Gain immediate access to the Excel-based MTDR DCF Calculator.
- Input Your Assumptions: Modify the yellow-highlighted cells for growth rates, WACC, margins, and other key variables.
- Instant Calculations: The model will automatically refresh to display Matador Resources Company's intrinsic value.
- Test Scenarios: Experiment with various assumptions to assess potential changes in valuation.
- Analyze and Decide: Leverage the results to inform your investment or financial analysis.
Why Choose Matador Resources Company (MTDR) Calculator?
- Accuracy: Utilize authentic Matador financials for precise data.
- Flexibility: Tailored for users to effortlessly adjust and test various inputs.
- Time-Saving: Eliminate the need to construct a model from the ground up.
- Professional-Grade: Crafted with the expertise and usability expected at the CFO level.
- User-Friendly: Intuitive design makes it accessible for users without extensive financial modeling skills.
Who Should Use This Product?
- Professional Investors: Create comprehensive and trustworthy valuation models for analyzing portfolios with Matador Resources (MTDR).
- Corporate Finance Teams: Evaluate valuation scenarios to inform strategic decisions within the company.
- Consultants and Advisors: Deliver precise valuation insights to clients regarding Matador Resources (MTDR) stock.
- Students and Educators: Utilize real-world data for hands-on practice and teaching in financial modeling.
- Energy Sector Enthusiasts: Gain insights into how companies like Matador Resources (MTDR) are valued in the energy market.
What the Template Contains
- Historical Data: Includes Matador Resources Company's past financials and baseline forecasts.
- DCF and Levered DCF Models: Detailed templates to calculate Matador Resources Company's intrinsic value.
- WACC Sheet: Pre-built calculations for Weighted Average Cost of Capital.
- Editable Inputs: Modify key drivers like growth rates, EBITDA %, and CAPEX assumptions.
- Quarterly and Annual Statements: A complete breakdown of Matador Resources Company's financials.
- Interactive Dashboard: Visualize valuation results and projections dynamically.
Disclaimer
All information, articles, and product details provided on this website are for general informational and educational purposes only. We do not claim any ownership over, nor do we intend to infringe upon, any trademarks, copyrights, logos, brand names, or other intellectual property mentioned or depicted on this site. Such intellectual property remains the property of its respective owners, and any references here are made solely for identification or informational purposes, without implying any affiliation, endorsement, or partnership.
We make no representations or warranties, express or implied, regarding the accuracy, completeness, or suitability of any content or products presented. Nothing on this website should be construed as legal, tax, investment, financial, medical, or other professional advice. In addition, no part of this site—including articles or product references—constitutes a solicitation, recommendation, endorsement, advertisement, or offer to buy or sell any securities, franchises, or other financial instruments, particularly in jurisdictions where such activity would be unlawful.
All content is of a general nature and may not address the specific circumstances of any individual or entity. It is not a substitute for professional advice or services. Any actions you take based on the information provided here are strictly at your own risk. You accept full responsibility for any decisions or outcomes arising from your use of this website and agree to release us from any liability in connection with your use of, or reliance upon, the content or products found herein.