
|
PageGroup plc (page.l) DCF Valoración |
Completamente Editable: Adáptelo A Sus Necesidades En Excel O Sheets
Diseño Profesional: Plantillas Confiables Y Estándares De La Industria
Predeterminadas Para Un Uso Rápido Y Eficiente
Compatible con MAC / PC, completamente desbloqueado
No Se Necesita Experiencia; Fáciles De Seguir
PageGroup plc (PAGE.L) Bundle
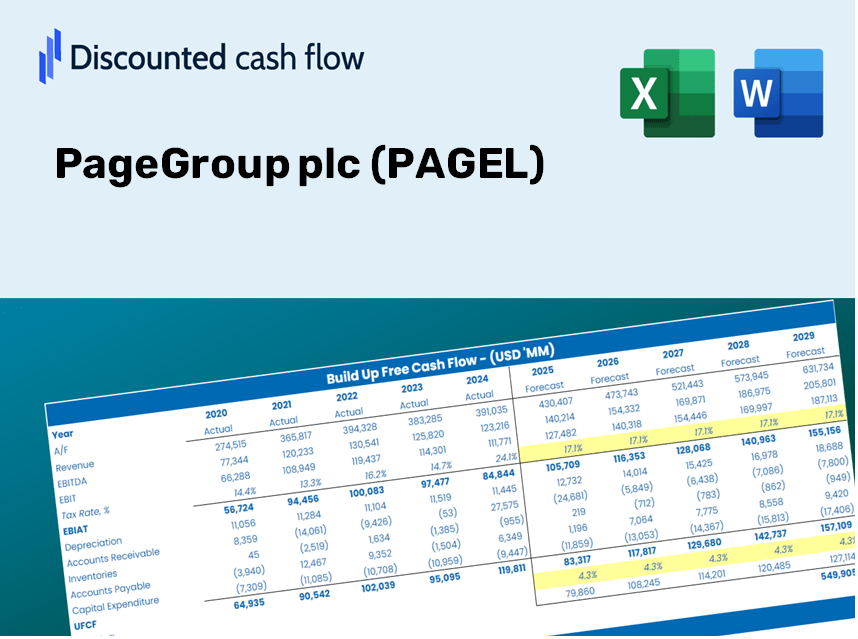
¡Descubra el verdadero valor de PageGroup plc con nuestra calculadora DCF de grado profesional! Ajuste los supuestos clave, explore varios escenarios y evalúe cómo los cambios afectan la valoración del grupo PAGE PLC, todo dentro de una sola plantilla de Excel.
Discounted Cash Flow (DCF) - (USD MM)
| Year | AY1 2020 |
AY2 2021 |
AY3 2022 |
AY4 2023 |
AY5 2024 |
FY1 2025 |
FY2 2026 |
FY3 2027 |
FY4 2028 |
FY5 2029 |
|---|---|---|---|---|---|---|---|---|---|---|
| Revenue | 1,304.8 | 1,643.7 | 1,990.3 | 2,010.3 | 1,738.9 | 1,889.2 | 2,052.5 | 2,229.8 | 2,422.5 | 2,631.9 |
| Revenue Growth, % | 0 | 25.98 | 21.08 | 1.01 | -13.5 | 8.64 | 8.64 | 8.64 | 8.64 | 8.64 |
| EBITDA | 79.4 | 222.5 | 257.8 | 187.8 | 117.5 | 183.9 | 199.8 | 217.1 | 235.8 | 256.2 |
| EBITDA, % | 6.09 | 13.54 | 12.95 | 9.34 | 6.76 | 9.74 | 9.74 | 9.74 | 9.74 | 9.74 |
| Depreciation | 61.8 | 53.7 | 60.6 | 66.8 | 62.9 | 68.0 | 73.8 | 80.2 | 87.2 | 94.7 |
| Depreciation, % | 4.74 | 3.27 | 3.04 | 3.32 | 3.62 | 3.6 | 3.6 | 3.6 | 3.6 | 3.6 |
| EBIT | 17.6 | 168.8 | 197.2 | 121.1 | 54.6 | 116.0 | 126.0 | 136.9 | 148.7 | 161.5 |
| EBIT, % | 1.35 | 10.27 | 9.91 | 6.02 | 3.14 | 6.14 | 6.14 | 6.14 | 6.14 | 6.14 |
| Total Cash | 166.0 | 154.0 | 131.5 | 90.1 | 95.3 | 146.1 | 158.7 | 172.4 | 187.3 | 203.5 |
| Total Cash, percent | .0 | .0 | .0 | .0 | .0 | .0 | .0 | .0 | .0 | .0 |
| Account Receivables | 241.8 | 342.8 | 418.3 | 270.5 | 300.4 | 344.4 | 374.1 | 406.5 | 441.6 | 479.7 |
| Account Receivables, % | 18.53 | 20.86 | 21.02 | 13.46 | 17.28 | 18.23 | 18.23 | 18.23 | 18.23 | 18.23 |
| Inventories | .0 | .0 | .0 | .0 | .0 | .0 | .0 | .0 | .0 | .0 |
| Inventories, % | 0 | 0 | 0 | 0 | 0 | 0 | 0 | 0 | 0 | 0 |
| Accounts Payable | 4.0 | 5.9 | 11.1 | 8.4 | 15.1 | 9.5 | 10.3 | 11.2 | 12.2 | 13.2 |
| Accounts Payable, % | 0.30603 | 0.35942 | 0.55776 | 0.417 | 0.86892 | 0.50183 | 0.50183 | 0.50183 | 0.50183 | 0.50183 |
| Capital Expenditure | -22.7 | -28.4 | -31.7 | -31.4 | -15.7 | -28.4 | -30.9 | -33.5 | -36.4 | -39.6 |
| Capital Expenditure, % | -1.74 | -1.73 | -1.59 | -1.56 | -0.90067 | -1.5 | -1.5 | -1.5 | -1.5 | -1.5 |
| Tax Rate, % | 42.1 | 42.1 | 42.1 | 42.1 | 42.1 | 42.1 | 42.1 | 42.1 | 42.1 | 42.1 |
| EBITAT | -6.5 | 119.9 | 141.0 | 79.4 | 31.6 | 61.7 | 67.0 | 72.8 | 79.1 | 86.0 |
| Depreciation | ||||||||||
| Changes in Account Receivables | ||||||||||
| Changes in Inventories | ||||||||||
| Changes in Accounts Payable | ||||||||||
| Capital Expenditure | ||||||||||
| UFCF | -205.2 | 46.1 | 99.7 | 259.9 | 55.7 | 51.7 | 81.1 | 88.1 | 95.7 | 104.0 |
| WACC, % | 7.27 | 7.71 | 7.71 | 7.68 | 7.63 | 7.6 | 7.6 | 7.6 | 7.6 | 7.6 |
| PV UFCF | ||||||||||
| SUM PV UFCF | 332.3 | |||||||||
| Long Term Growth Rate, % | 1.00 | |||||||||
| Free cash flow (T + 1) | 105 | |||||||||
| Terminal Value | 1,591 | |||||||||
| Present Terminal Value | 1,103 | |||||||||
| Enterprise Value | 1,436 | |||||||||
| Net Debt | 41 | |||||||||
| Equity Value | 1,394 | |||||||||
| Diluted Shares Outstanding, MM | 315 | |||||||||
| Equity Value Per Share | 442.46 |
What You Will Receive
- Customizable Excel Template: A fully adjustable Excel-based DCF Calculator featuring pre-filled financial data for PageGroup plc (PAGEL).
- Accurate Data: Historical performance metrics and forward-looking projections (highlighted in the yellow cells).
- Forecasting Flexibility: Modify assumptions such as revenue growth, EBITDA percentages, and WACC.
- Real-Time Calculations: Instantly observe how your inputs influence PageGroup's valuation.
- Professional Resource: Designed for investors, CFOs, consultants, and financial analysts.
- User-Friendly Interface: Organized for clarity and ease of use, complete with step-by-step guidance.
Key Features
- Real-Life PAGEL Data: Pre-filled with PageGroup plc’s historical financials and forward-looking projections.
- Fully Customizable Inputs: Modify revenue growth, profit margins, WACC, tax rates, and capital expenditures as needed.
- Dynamic Valuation Model: Automatic recalculations of Net Present Value (NPV) and intrinsic value based on your inputs.
- Scenario Testing: Generate various forecasting scenarios to explore different valuation results.
- User-Friendly Design: Intuitive and organized layout catering to both professionals and novices.
How It Functions
- Step 1: Download the Excel file.
- Step 2: Examine the pre-filled PageGroup plc (PAGEL) data (historical and forecasted).
- Step 3: Modify key assumptions (yellow cells) according to your insights.
- Step 4: Observe automatic recalculations for PageGroup plc’s intrinsic value.
- Step 5: Utilize the results for investment strategies or reporting purposes.
Why Choose This Calculator for PageGroup plc (PAGEL)?
- Designed for Experts: A sophisticated tool utilized by analysts, CFOs, and consultants.
- Accurate Data: PageGroup's historical and projected financials provided for precision.
- Flexible Scenario Analysis: Effortlessly test different forecasts and assumptions.
- Insightful Outputs: Automatically computes intrinsic value, NPV, and essential metrics.
- User-Friendly: Comprehensive step-by-step instructions to assist you throughout the process.
Who Can Benefit from This Product?
- Professional Investors: Create comprehensive and accurate valuation models for portfolio assessments.
- Corporate Finance Teams: Evaluate valuation scenarios to inform strategic decision-making.
- Consultants and Advisors: Deliver precise valuation insights for PageGroup plc (PAGEL) to clients.
- Students and Educators: Utilize real-world data for practicing and teaching financial modeling techniques.
- Recruitment Enthusiasts: Gain insights into how companies like PageGroup plc (PAGEL) are valued in the recruitment industry.
Your Guide to the Template Features
- Pre-Filled DCF Model: PageGroup plc's (PAGEL) financial data preloaded for immediate analysis.
- WACC Calculator: Comprehensive calculations for Weighted Average Cost of Capital.
- Financial Ratios: Assess PageGroup plc's (PAGEL) profitability, leverage, and operational efficiency.
- Editable Inputs: Adjust variables such as growth rates, profit margins, and CAPEX to align with your forecasts.
- Financial Statements: Access annual and quarterly reports for in-depth evaluation.
- Interactive Dashboard: Effortlessly visualize essential valuation metrics and outcomes.
Disclaimer
All information, articles, and product details provided on this website are for general informational and educational purposes only. We do not claim any ownership over, nor do we intend to infringe upon, any trademarks, copyrights, logos, brand names, or other intellectual property mentioned or depicted on this site. Such intellectual property remains the property of its respective owners, and any references here are made solely for identification or informational purposes, without implying any affiliation, endorsement, or partnership.
We make no representations or warranties, express or implied, regarding the accuracy, completeness, or suitability of any content or products presented. Nothing on this website should be construed as legal, tax, investment, financial, medical, or other professional advice. In addition, no part of this site—including articles or product references—constitutes a solicitation, recommendation, endorsement, advertisement, or offer to buy or sell any securities, franchises, or other financial instruments, particularly in jurisdictions where such activity would be unlawful.
All content is of a general nature and may not address the specific circumstances of any individual or entity. It is not a substitute for professional advice or services. Any actions you take based on the information provided here are strictly at your own risk. You accept full responsibility for any decisions or outcomes arising from your use of this website and agree to release us from any liability in connection with your use of, or reliance upon, the content or products found herein.