
|
Valoración DCF de PENN Entertainment, Inc. (PENN) |
Completamente Editable: Adáptelo A Sus Necesidades En Excel O Sheets
Diseño Profesional: Plantillas Confiables Y Estándares De La Industria
Predeterminadas Para Un Uso Rápido Y Eficiente
Compatible con MAC / PC, completamente desbloqueado
No Se Necesita Experiencia; Fáciles De Seguir
PENN Entertainment, Inc. (PENN) Bundle
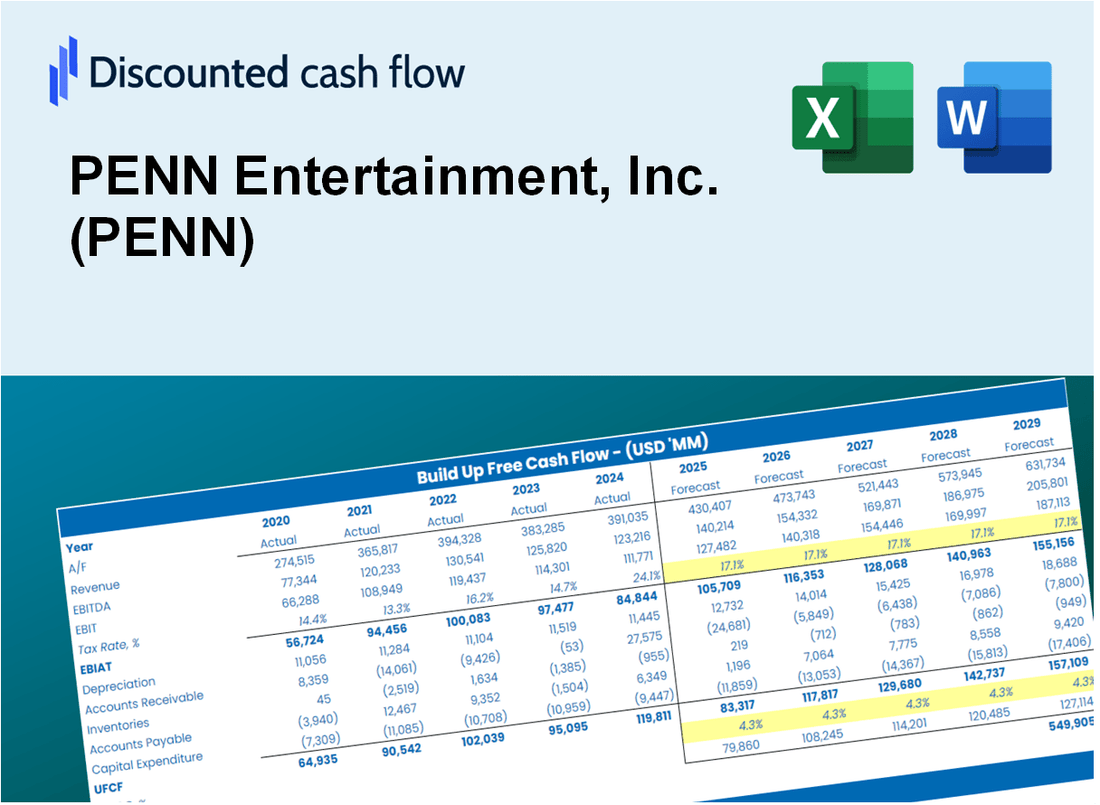
Diseñado para la precisión, nuestra calculadora DCF (PENN) le permite evaluar la valoración de Penn Entertainment, Inc. utilizando datos financieros del mundo real y ofrece una flexibilidad completa para modificar todos los parámetros esenciales para mejorar las proyecciones.
Discounted Cash Flow (DCF) - (USD MM)
| Year | AY1 2020 |
AY2 2021 |
AY3 2022 |
AY4 2023 |
AY5 2024 |
FY1 2025 |
FY2 2026 |
FY3 2027 |
FY4 2028 |
FY5 2029 |
|---|---|---|---|---|---|---|---|---|---|---|
| Revenue | 3,578.7 | 5,905.0 | 6,401.7 | 6,362.9 | 6,578.1 | 7,831.1 | 9,322.7 | 11,098.5 | 13,212.6 | 15,729.3 |
| Revenue Growth, % | 0 | 65 | 8.41 | -0.60609 | 3.38 | 19.05 | 19.05 | 19.05 | 19.05 | 19.05 |
| EBITDA | 76.6 | 1,446.4 | 1,501.0 | 400.2 | 562.8 | 1,016.9 | 1,210.6 | 1,441.2 | 1,715.7 | 2,042.5 |
| EBITDA, % | 2.14 | 24.49 | 23.45 | 6.29 | 8.56 | 12.99 | 12.99 | 12.99 | 12.99 | 12.99 |
| Depreciation | 366.7 | 344.5 | 567.5 | 435.1 | 433.6 | 601.0 | 715.5 | 851.8 | 1,014.1 | 1,207.2 |
| Depreciation, % | 10.25 | 5.83 | 8.86 | 6.84 | 6.59 | 7.68 | 7.68 | 7.68 | 7.68 | 7.68 |
| EBIT | -290.1 | 1,101.9 | 933.5 | -34.9 | 129.2 | 415.9 | 495.1 | 589.4 | 701.6 | 835.3 |
| EBIT, % | -8.11 | 18.66 | 14.58 | -0.54849 | 1.96 | 5.31 | 5.31 | 5.31 | 5.31 | 5.31 |
| Total Cash | 1,853.8 | 1,863.9 | 1,624.0 | 1,071.8 | 706.6 | 2,135.1 | 2,541.8 | 3,025.9 | 3,602.3 | 4,288.4 |
| Total Cash, percent | .0 | .0 | .0 | .0 | .0 | .0 | .0 | .0 | .0 | .0 |
| Account Receivables | 96.4 | 195.0 | 246.4 | 319.0 | 256.8 | 293.9 | 349.8 | 416.5 | 495.8 | 590.2 |
| Account Receivables, % | 2.69 | 3.3 | 3.85 | 5.01 | 3.9 | 3.75 | 3.75 | 3.75 | 3.75 | 3.75 |
| Inventories | .0 | 132.3 | 106.1 | .0 | .0 | 61.0 | 72.7 | 86.5 | 103.0 | 122.6 |
| Inventories, % | 0 | 2.24 | 1.66 | 0 | 0 | 0.77957 | 0.77957 | 0.77957 | 0.77957 | 0.77957 |
| Accounts Payable | 33.2 | 53.3 | 40.1 | 36.6 | 50.8 | 59.6 | 70.9 | 84.4 | 100.5 | 119.7 |
| Accounts Payable, % | 0.92771 | 0.90262 | 0.6264 | 0.57521 | 0.77226 | 0.76084 | 0.76084 | 0.76084 | 0.76084 | 0.76084 |
| Capital Expenditure | -141.8 | -268.3 | -272.4 | -360.0 | -482.7 | -403.4 | -480.2 | -571.7 | -680.6 | -810.3 |
| Capital Expenditure, % | -3.96 | -4.54 | -4.26 | -5.66 | -7.34 | -5.15 | -5.15 | -5.15 | -5.15 | -5.15 |
| Tax Rate, % | 8.73 | 8.73 | 8.73 | 8.73 | 8.73 | 8.73 | 8.73 | 8.73 | 8.73 | 8.73 |
| EBITAT | -232.8 | 860.1 | 1,182.7 | -34.2 | 117.9 | 372.3 | 443.2 | 527.7 | 628.2 | 747.8 |
| Depreciation | ||||||||||
| Changes in Account Receivables | ||||||||||
| Changes in Inventories | ||||||||||
| Changes in Accounts Payable | ||||||||||
| Capital Expenditure | ||||||||||
| UFCF | -71.1 | 725.5 | 1,439.4 | 70.9 | 145.2 | 480.6 | 622.3 | 740.8 | 881.9 | 1,049.9 |
| WACC, % | 4.51 | 4.43 | 5.2 | 5.13 | 4.89 | 4.83 | 4.83 | 4.83 | 4.83 | 4.83 |
| PV UFCF | ||||||||||
| SUM PV UFCF | 3,227.4 | |||||||||
| Long Term Growth Rate, % | 0.50 | |||||||||
| Free cash flow (T + 1) | 1,055 | |||||||||
| Terminal Value | 24,371 | |||||||||
| Present Terminal Value | 19,251 | |||||||||
| Enterprise Value | 22,479 | |||||||||
| Net Debt | 10,543 | |||||||||
| Equity Value | 11,936 | |||||||||
| Diluted Shares Outstanding, MM | 152 | |||||||||
| Equity Value Per Share | 78.48 |
What You Will Get
- Real PENN Data: Preloaded financials – from revenue to EBIT – based on actual and projected figures.
- Full Customization: Adjust all critical parameters (yellow cells) like WACC, growth %, and tax rates.
- Instant Valuation Updates: Automatic recalculations to analyze the impact of changes on PENN Entertainment’s fair value.
- Versatile Excel Template: Tailored for quick edits, scenario testing, and detailed projections.
- Time-Saving and Accurate: Skip building models from scratch while maintaining precision and flexibility.
Key Features
- 🔍 Real-Life PENN Financials: Pre-filled historical and projected data for PENN Entertainment, Inc. (PENN).
- ✏️ Fully Customizable Inputs: Adjust all critical parameters (yellow cells) like WACC, growth %, and tax rates.
- 📊 Professional DCF Valuation: Built-in formulas calculate PENN’s intrinsic value using the Discounted Cash Flow method.
- ⚡ Instant Results: Visualize PENN’s valuation instantly after making changes.
- Scenario Analysis: Test and compare outcomes for various financial assumptions side-by-side.
How It Works
- Download the Template: Get instant access to the Excel-based PENN DCF Calculator.
- Input Your Assumptions: Adjust yellow-highlighted cells for growth rates, WACC, margins, and more.
- Instant Calculations: The model automatically updates PENN Entertainment’s intrinsic value.
- Test Scenarios: Simulate different assumptions to evaluate potential valuation changes.
- Analyze and Decide: Use the results to guide your investment or financial analysis.
Why Choose PENN Entertainment, Inc. (PENN)?
- Time Efficiency: Skip the hassle of complex models – our solutions are ready for immediate use.
- Enhanced Precision: Access to accurate financial data and methodologies minimizes valuation errors.
- Completely Customizable: Adapt the tools to align with your unique assumptions and forecasts.
- User-Friendly: Intuitive visuals and outputs simplify result interpretation.
- Endorsed by Industry Leaders: Crafted for professionals prioritizing accuracy and functionality.
Who Should Use This Product?
- Finance Students: Master valuation methods and practice with real-time data for PENN Entertainment, Inc. (PENN).
- Academics: Utilize industry-standard models for your teaching or research involving PENN.
- Investors: Validate your investment strategies and evaluate the valuation metrics for PENN stock.
- Analysts: Enhance your analysis process with a ready-to-use, adaptable DCF model tailored for PENN.
- Small Business Owners: Discover how major public companies like PENN are evaluated in the market.
What the Template Contains
- Operating and Balance Sheet Data: Pre-filled PENN Entertainment historical data and forecasts, including revenue, EBITDA, EBIT, and capital expenditures.
- WACC Calculation: A dedicated sheet for Weighted Average Cost of Capital (WACC), including parameters like Beta, risk-free rate, and share price.
- DCF Valuation (Unlevered and Levered): Editable Discounted Cash Flow models showing intrinsic value with detailed calculations.
- Financial Statements: Pre-loaded financial statements (annual and quarterly) to support analysis.
- Key Ratios: Includes profitability, leverage, and efficiency ratios for PENN Entertainment, Inc. (PENN).
- Dashboard and Charts: Visual summary of valuation outputs and assumptions to analyze results easily.
Disclaimer
All information, articles, and product details provided on this website are for general informational and educational purposes only. We do not claim any ownership over, nor do we intend to infringe upon, any trademarks, copyrights, logos, brand names, or other intellectual property mentioned or depicted on this site. Such intellectual property remains the property of its respective owners, and any references here are made solely for identification or informational purposes, without implying any affiliation, endorsement, or partnership.
We make no representations or warranties, express or implied, regarding the accuracy, completeness, or suitability of any content or products presented. Nothing on this website should be construed as legal, tax, investment, financial, medical, or other professional advice. In addition, no part of this site—including articles or product references—constitutes a solicitation, recommendation, endorsement, advertisement, or offer to buy or sell any securities, franchises, or other financial instruments, particularly in jurisdictions where such activity would be unlawful.
All content is of a general nature and may not address the specific circumstances of any individual or entity. It is not a substitute for professional advice or services. Any actions you take based on the information provided here are strictly at your own risk. You accept full responsibility for any decisions or outcomes arising from your use of this website and agree to release us from any liability in connection with your use of, or reliance upon, the content or products found herein.