
|
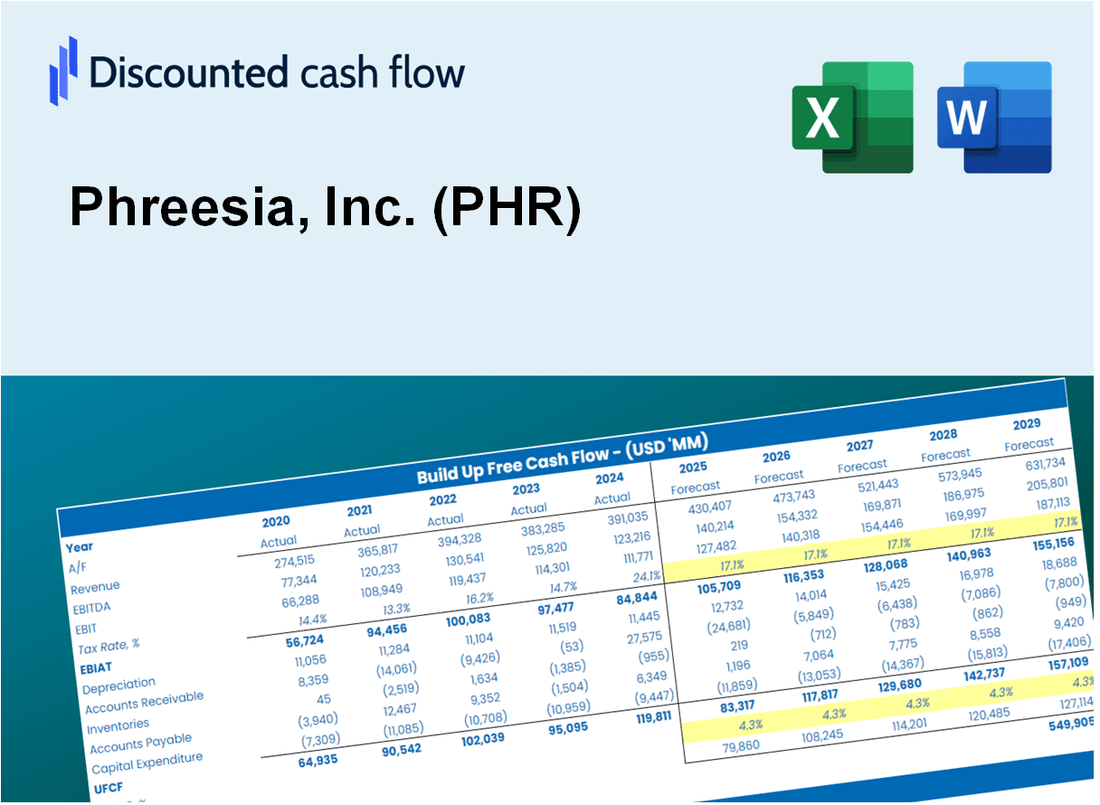
Valoración DCF de Phreesia, Inc. (PHR) |
Completamente Editable: Adáptelo A Sus Necesidades En Excel O Sheets
Diseño Profesional: Plantillas Confiables Y Estándares De La Industria
Predeterminadas Para Un Uso Rápido Y Eficiente
Compatible con MAC / PC, completamente desbloqueado
No Se Necesita Experiencia; Fáciles De Seguir
Phreesia, Inc. (PHR) Bundle
¡Obtenga información sobre su análisis de valoración de Phreesia, Inc. (PHR) con nuestra calculadora DCF de última generación! Esta plantilla de Excel viene precargada con datos de PHR reales, lo que le permite ajustar los pronósticos y supuestos para un cálculo preciso del valor intrínseco de Phreesia, Inc.
Discounted Cash Flow (DCF) - (USD MM)
| Year | AY1 2021 |
AY2 2022 |
AY3 2023 |
AY4 2024 |
AY5 2025 |
FY1 2026 |
FY2 2027 |
FY3 2028 |
FY4 2029 |
FY5 2030 |
|---|---|---|---|---|---|---|---|---|---|---|
| Revenue | 148.7 | 213.2 | 280.9 | 356.3 | 419.8 | 545.6 | 709.0 | 921.4 | 1,197.4 | 1,556.1 |
| Revenue Growth, % | 0 | 43.42 | 31.74 | 26.84 | 17.83 | 29.96 | 29.96 | 29.96 | 29.96 | 29.96 |
| EBITDA | -7.6 | -92.3 | -145.5 | -102.9 | -25.6 | -147.5 | -191.7 | -249.1 | -323.7 | -420.7 |
| EBITDA, % | -5.12 | -43.29 | -51.79 | -28.89 | -6.09 | -27.04 | -27.04 | -27.04 | -27.04 | -27.04 |
| Depreciation | 17.9 | 24.5 | 28.8 | 30.5 | 27.9 | 53.5 | 69.5 | 90.3 | 117.4 | 152.5 |
| Depreciation, % | 12.06 | 11.5 | 10.24 | 8.57 | 6.64 | 9.8 | 9.8 | 9.8 | 9.8 | 9.8 |
| EBIT | -25.5 | -116.8 | -174.3 | -133.5 | -53.5 | -201.0 | -261.2 | -339.4 | -441.1 | -573.3 |
| EBIT, % | -17.18 | -54.78 | -62.03 | -37.47 | -12.74 | -36.84 | -36.84 | -36.84 | -36.84 | -36.84 |
| Total Cash | 218.8 | 313.8 | 176.7 | 87.5 | 84.2 | 335.5 | 436.1 | 566.7 | 736.4 | 957.1 |
| Total Cash, percent | .0 | .0 | .0 | .0 | .0 | .0 | .0 | .0 | .0 | .0 |
| Account Receivables | 29.1 | 40.3 | 51.4 | 64.9 | 73.6 | 100.9 | 131.1 | 170.4 | 221.4 | 287.7 |
| Account Receivables, % | 19.54 | 18.88 | 18.3 | 18.2 | 17.54 | 18.49 | 18.49 | 18.49 | 18.49 | 18.49 |
| Inventories | 8.9 | 1.6 | 1.1 | .8 | .0 | 8.1 | 10.5 | 13.6 | 17.7 | 23.0 |
| Inventories, % | 6.02 | 0.77005 | 0.37592 | 0.21555 | 0 | 1.48 | 1.48 | 1.48 | 1.48 | 1.48 |
| Accounts Payable | 4.4 | 5.1 | 10.8 | 8.5 | 5.6 | 14.1 | 18.3 | 23.8 | 31.0 | 40.2 |
| Accounts Payable, % | 2.95 | 2.4 | 3.86 | 2.38 | 1.34 | 2.59 | 2.59 | 2.59 | 2.59 | 2.59 |
| Capital Expenditure | -18.6 | -30.8 | -26.2 | -25.1 | -24.1 | -53.5 | -69.6 | -90.4 | -117.5 | -152.7 |
| Capital Expenditure, % | -12.49 | -14.45 | -9.33 | -7.04 | -5.74 | -9.81 | -9.81 | -9.81 | -9.81 | -9.81 |
| Tax Rate, % | -4.87 | -4.87 | -4.87 | -4.87 | -4.87 | -4.87 | -4.87 | -4.87 | -4.87 | -4.87 |
| EBITAT | -25.6 | -117.0 | -174.7 | -135.0 | -56.1 | -201.0 | -261.2 | -339.4 | -441.1 | -573.3 |
| Depreciation | ||||||||||
| Changes in Account Receivables | ||||||||||
| Changes in Inventories | ||||||||||
| Changes in Accounts Payable | ||||||||||
| Capital Expenditure | ||||||||||
| UFCF | -59.8 | -126.5 | -177.0 | -145.1 | -63.1 | -227.9 | -289.6 | -376.4 | -489.2 | -635.7 |
| WACC, % | 6.83 | 6.83 | 6.83 | 6.83 | 6.83 | 6.83 | 6.83 | 6.83 | 6.83 | 6.83 |
| PV UFCF | ||||||||||
| SUM PV UFCF | -1,608.4 | |||||||||
| Long Term Growth Rate, % | 2.00 | |||||||||
| Free cash flow (T + 1) | -648 | |||||||||
| Terminal Value | -13,432 | |||||||||
| Present Terminal Value | -9,654 | |||||||||
| Enterprise Value | -11,263 | |||||||||
| Net Debt | -66 | |||||||||
| Equity Value | -11,196 | |||||||||
| Diluted Shares Outstanding, MM | 58 | |||||||||
| Equity Value Per Share | -194.41 |
What You Will Get
- Real PHR Financial Data: Pre-filled with Phreesia’s historical and projected data for precise analysis.
- Fully Editable Template: Modify key inputs like revenue growth, WACC, and EBITDA % with ease.
- Automatic Calculations: See Phreesia’s intrinsic value update instantly based on your changes.
- Professional Valuation Tool: Designed for investors, analysts, and consultants seeking accurate DCF results.
- User-Friendly Design: Simple structure and clear instructions for all experience levels.
Key Features
- 🔍 Real-Life PHR Financials: Pre-filled historical and projected data for Phreesia, Inc. (PHR).
- ✏️ Fully Customizable Inputs: Adjust all critical parameters (yellow cells) like WACC, growth %, and tax rates.
- 📊 Professional DCF Valuation: Built-in formulas calculate Phreesia’s intrinsic value using the Discounted Cash Flow method.
- ⚡ Instant Results: Visualize Phreesia’s valuation instantly after making changes.
- Scenario Analysis: Test and compare outcomes for various financial assumptions side-by-side.
How It Works
- Step 1: Download the prebuilt Excel template with Phreesia, Inc.'s (PHR) data included.
- Step 2: Explore the pre-filled sheets and understand the key metrics.
- Step 3: Update forecasts and assumptions in the editable yellow cells (WACC, growth, margins).
- Step 4: Instantly view recalculated results, including Phreesia, Inc.'s (PHR) intrinsic value.
- Step 5: Make informed investment decisions or generate reports using the outputs.
Why Choose Phreesia's Calculator?
- Accuracy: Utilizes real Phreesia financial data to ensure precise calculations.
- Flexibility: Built for users to easily adjust and experiment with various inputs.
- Time-Saving: Avoid the complexities of constructing a financial model from the ground up.
- Professional-Grade: Crafted with the expertise and attention to detail expected at the CFO level.
- User-Friendly: Intuitive design makes it accessible for users with varying levels of financial knowledge.
Who Should Use This Product?
- Healthcare Investors: Develop comprehensive valuation models for analyzing investments in healthcare technology.
- Corporate Finance Teams: Evaluate valuation scenarios to inform strategic decisions within healthcare organizations.
- Consultants and Advisors: Deliver precise valuation insights for Phreesia, Inc. (PHR) to clients seeking market guidance.
- Students and Educators: Utilize real-world data to learn and teach financial modeling in the healthcare sector.
- Tech Enthusiasts: Gain insights into how healthcare technology companies like Phreesia, Inc. (PHR) are valued in the market.
What the Template Contains
- Historical Data: Includes Phreesia, Inc.’s past financials and baseline forecasts.
- DCF and Levered DCF Models: Detailed templates to calculate Phreesia, Inc.'s intrinsic value.
- WACC Sheet: Pre-built calculations for Weighted Average Cost of Capital.
- Editable Inputs: Modify key drivers like growth rates, EBITDA %, and CAPEX assumptions.
- Quarterly and Annual Statements: A complete breakdown of Phreesia, Inc.'s financials.
- Interactive Dashboard: Visualize valuation results and projections dynamically.
Disclaimer
All information, articles, and product details provided on this website are for general informational and educational purposes only. We do not claim any ownership over, nor do we intend to infringe upon, any trademarks, copyrights, logos, brand names, or other intellectual property mentioned or depicted on this site. Such intellectual property remains the property of its respective owners, and any references here are made solely for identification or informational purposes, without implying any affiliation, endorsement, or partnership.
We make no representations or warranties, express or implied, regarding the accuracy, completeness, or suitability of any content or products presented. Nothing on this website should be construed as legal, tax, investment, financial, medical, or other professional advice. In addition, no part of this site—including articles or product references—constitutes a solicitation, recommendation, endorsement, advertisement, or offer to buy or sell any securities, franchises, or other financial instruments, particularly in jurisdictions where such activity would be unlawful.
All content is of a general nature and may not address the specific circumstances of any individual or entity. It is not a substitute for professional advice or services. Any actions you take based on the information provided here are strictly at your own risk. You accept full responsibility for any decisions or outcomes arising from your use of this website and agree to release us from any liability in connection with your use of, or reliance upon, the content or products found herein.