|
Valoración DCF de Roblox Corporation (RBLX) |
Completamente Editable: Adáptelo A Sus Necesidades En Excel O Sheets
Diseño Profesional: Plantillas Confiables Y Estándares De La Industria
Predeterminadas Para Un Uso Rápido Y Eficiente
Compatible con MAC / PC, completamente desbloqueado
No Se Necesita Experiencia; Fáciles De Seguir
Roblox Corporation (RBLX) Bundle
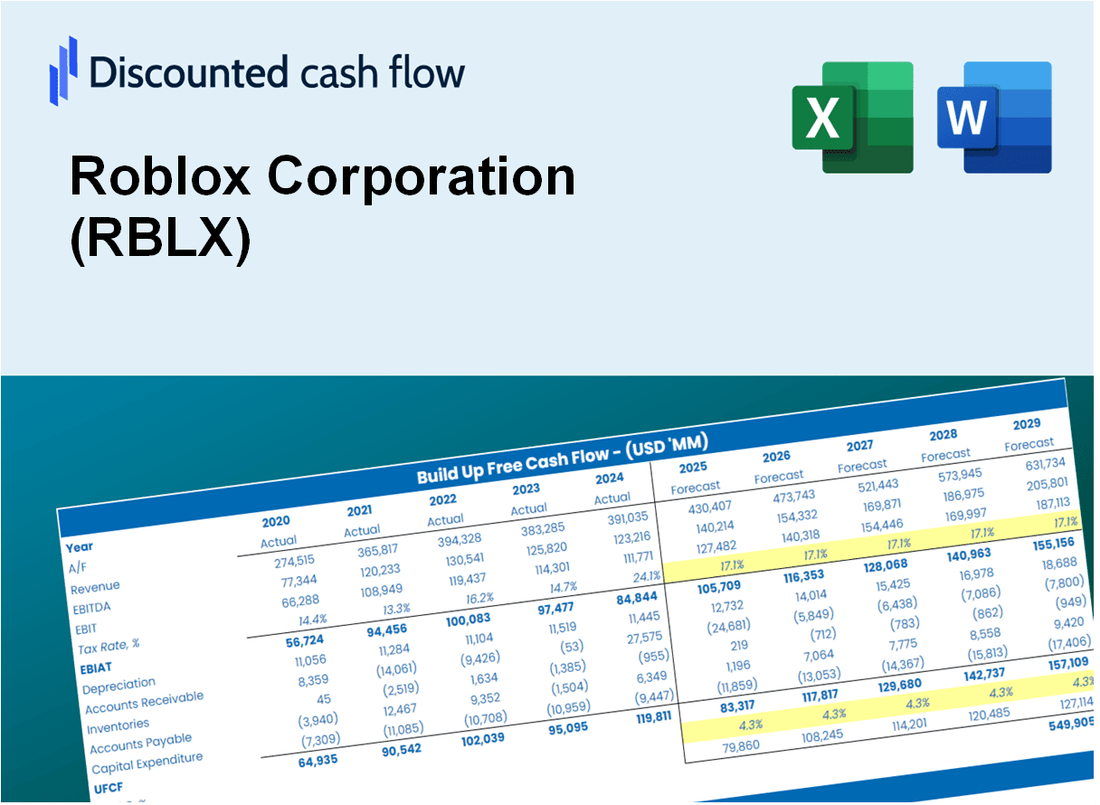
¡Evalúe las perspectivas financieras de Roblox Corporation (RBLX) como un experto! Esta calculadora DCF (RBLX) le proporciona datos financieros previamente llenos y flexibilidad completa para modificar el crecimiento de los ingresos, WACC, los márgenes y otros supuestos esenciales para alinearse con sus predicciones.
Discounted Cash Flow (DCF) - (USD MM)
| Year | AY1 2020 |
AY2 2021 |
AY3 2022 |
AY4 2023 |
AY5 2024 |
FY1 2025 |
FY2 2026 |
FY3 2027 |
FY4 2028 |
FY5 2029 |
|---|---|---|---|---|---|---|---|---|---|---|
| Revenue | 923.9 | 1,919.2 | 2,225.1 | 2,799.3 | 3,602.0 | 5,136.6 | 7,325.1 | 10,445.9 | 14,896.4 | 21,243.0 |
| Revenue Growth, % | 0 | 107.73 | 15.94 | 25.81 | 28.68 | 42.61 | 42.61 | 42.61 | 42.61 | 42.61 |
| EBITDA | -220.5 | -421.4 | -761.9 | -911.0 | -670.3 | -1,348.0 | -1,922.4 | -2,741.4 | -3,909.4 | -5,574.9 |
| EBITDA, % | -23.87 | -21.96 | -34.24 | -32.54 | -18.61 | -26.24 | -26.24 | -26.24 | -26.24 | -26.24 |
| Depreciation | 43.8 | 75.6 | 130.1 | 208.1 | 226.4 | 290.2 | 413.9 | 590.2 | 841.7 | 1,200.2 |
| Depreciation, % | 4.74 | 3.94 | 5.85 | 7.44 | 6.29 | 5.65 | 5.65 | 5.65 | 5.65 | 5.65 |
| EBIT | -264.3 | -497.0 | -891.9 | -1,119.1 | -896.7 | -1,638.3 | -2,336.2 | -3,331.6 | -4,751.0 | -6,775.2 |
| EBIT, % | -28.61 | -25.9 | -40.09 | -39.98 | -24.89 | -31.89 | -31.89 | -31.89 | -31.89 | -31.89 |
| Total Cash | 893.9 | 3,004.3 | 2,977.5 | 2,193.3 | 2,409.5 | 4,540.8 | 6,475.4 | 9,234.3 | 13,168.6 | 18,779.0 |
| Total Cash, percent | .0 | .0 | .0 | .0 | .0 | .0 | .0 | .0 | .0 | .0 |
| Account Receivables | 247.0 | 307.3 | 379.4 | 520.5 | 634.5 | 986.3 | 1,406.5 | 2,005.7 | 2,860.3 | 4,078.9 |
| Account Receivables, % | 26.73 | 16.01 | 17.05 | 18.59 | 17.62 | 19.2 | 19.2 | 19.2 | 19.2 | 19.2 |
| Inventories | .0 | .0 | .0 | .0 | .0 | .0 | .0 | .0 | .0 | .0 |
| Inventories, % | 0 | 0 | 0 | 0 | 0 | 0 | 0 | 0 | 0 | 0 |
| Accounts Payable | 12.0 | 64.4 | 71.2 | 60.1 | 42.9 | 115.0 | 164.0 | 233.8 | 333.4 | 475.5 |
| Accounts Payable, % | 1.3 | 3.36 | 3.2 | 2.15 | 1.19 | 2.24 | 2.24 | 2.24 | 2.24 | 2.24 |
| Capital Expenditure | -113.1 | -101.1 | -427.7 | -334.2 | -179.6 | -551.2 | -786.1 | -1,121.0 | -1,598.6 | -2,279.7 |
| Capital Expenditure, % | -12.24 | -5.27 | -19.22 | -11.94 | -4.99 | -10.73 | -10.73 | -10.73 | -10.73 | -10.73 |
| Tax Rate, % | 0.11917 | 0.11917 | 0.11917 | 0.11917 | 0.11917 | 0.11917 | 0.11917 | 0.11917 | 0.11917 | 0.11917 |
| EBITAT | -253.3 | -485.0 | -886.0 | -1,112.8 | -895.6 | -1,612.2 | -2,299.0 | -3,278.6 | -4,675.4 | -6,667.3 |
| Depreciation | ||||||||||
| Changes in Account Receivables | ||||||||||
| Changes in Inventories | ||||||||||
| Changes in Accounts Payable | ||||||||||
| Capital Expenditure | ||||||||||
| UFCF | -557.5 | -518.5 | -1,248.8 | -1,391.0 | -980.1 | -2,152.9 | -3,042.5 | -4,338.8 | -6,187.3 | -8,823.4 |
| WACC, % | 11.15 | 11.15 | 11.15 | 11.15 | 11.15 | 11.15 | 11.15 | 11.15 | 11.15 | 11.15 |
| PV UFCF | ||||||||||
| SUM PV UFCF | -16,815.4 | |||||||||
| Long Term Growth Rate, % | 2.00 | |||||||||
| Free cash flow (T + 1) | -9,000 | |||||||||
| Terminal Value | -98,386 | |||||||||
| Present Terminal Value | -58,001 | |||||||||
| Enterprise Value | -74,817 | |||||||||
| Net Debt | 1,094 | |||||||||
| Equity Value | -75,910 | |||||||||
| Diluted Shares Outstanding, MM | 647 | |||||||||
| Equity Value Per Share | -117.24 |
What You Will Get
- Real Roblox Data: Preloaded financials – from revenue to EBIT – based on actual and projected figures.
- Full Customization: Adjust all critical parameters (yellow cells) like WACC, growth %, and tax rates.
- Instant Valuation Updates: Automatic recalculations to analyze the impact of changes on Roblox’s fair value.
- Versatile Excel Template: Tailored for quick edits, scenario testing, and detailed projections.
- Time-Saving and Accurate: Skip building models from scratch while maintaining precision and flexibility.
Key Features
- Real-Time RBLX Data: Pre-loaded with Roblox Corporation's historical metrics and projected growth figures.
- Fully Customizable Inputs: Modify user engagement, revenue streams, operating margins, tax rates, and capital investments.
- Dynamic Valuation Model: Automatic recalculations of Net Present Value (NPV) and intrinsic value based on your specified parameters.
- Scenario Testing: Develop various forecasting scenarios to evaluate different valuation possibilities.
- User-Friendly Interface: Intuitive, organized, and crafted for both industry professionals and newcomers.
How It Works
- Download the Template: Get instant access to the Excel-based RBLX DCF Calculator.
- Input Your Assumptions: Adjust yellow-highlighted cells for growth rates, WACC, margins, and more.
- Instant Calculations: The model automatically updates Roblox’s intrinsic value.
- Test Scenarios: Simulate different assumptions to evaluate potential valuation changes.
- Analyze and Decide: Use the results to guide your investment or financial analysis.
Why Choose Roblox Corporation (RBLX)?
- Engaging Experiences: Offers a platform for immersive gaming and creativity.
- Strong Community: Connects millions of users, fostering collaboration and social interaction.
- Innovative Technology: Utilizes cutting-edge tools for game development and user engagement.
- Robust Revenue Model: Diverse income streams from in-game purchases and developer partnerships.
- Industry Recognition: A leader in the gaming sector, trusted by developers and players alike.
Who Should Use Roblox Corporation (RBLX)?
- Gamers: Explore immersive experiences and create your own games using a user-friendly platform.
- Developers: Leverage powerful tools to design and monetize your games efficiently.
- Investors: Analyze market trends and opportunities within the rapidly growing gaming industry.
- Educators: Utilize the platform to teach coding and game design concepts in an engaging way.
- Parents: Discover safe and fun gaming experiences for children while fostering creativity.
What the Template Contains
- Pre-Filled Data: Includes Roblox Corporation's historical financials and forecasts.
- Discounted Cash Flow Model: Editable DCF valuation model with automatic calculations.
- Weighted Average Cost of Capital (WACC): A dedicated sheet for calculating WACC based on custom inputs.
- Key Financial Ratios: Analyze Roblox Corporation's profitability, efficiency, and leverage.
- Customizable Inputs: Edit revenue growth, margins, and tax rates with ease.
- Clear Dashboard: Charts and tables summarizing key valuation results.
Disclaimer
All information, articles, and product details provided on this website are for general informational and educational purposes only. We do not claim any ownership over, nor do we intend to infringe upon, any trademarks, copyrights, logos, brand names, or other intellectual property mentioned or depicted on this site. Such intellectual property remains the property of its respective owners, and any references here are made solely for identification or informational purposes, without implying any affiliation, endorsement, or partnership.
We make no representations or warranties, express or implied, regarding the accuracy, completeness, or suitability of any content or products presented. Nothing on this website should be construed as legal, tax, investment, financial, medical, or other professional advice. In addition, no part of this site—including articles or product references—constitutes a solicitation, recommendation, endorsement, advertisement, or offer to buy or sell any securities, franchises, or other financial instruments, particularly in jurisdictions where such activity would be unlawful.
All content is of a general nature and may not address the specific circumstances of any individual or entity. It is not a substitute for professional advice or services. Any actions you take based on the information provided here are strictly at your own risk. You accept full responsibility for any decisions or outcomes arising from your use of this website and agree to release us from any liability in connection with your use of, or reliance upon, the content or products found herein.