
|
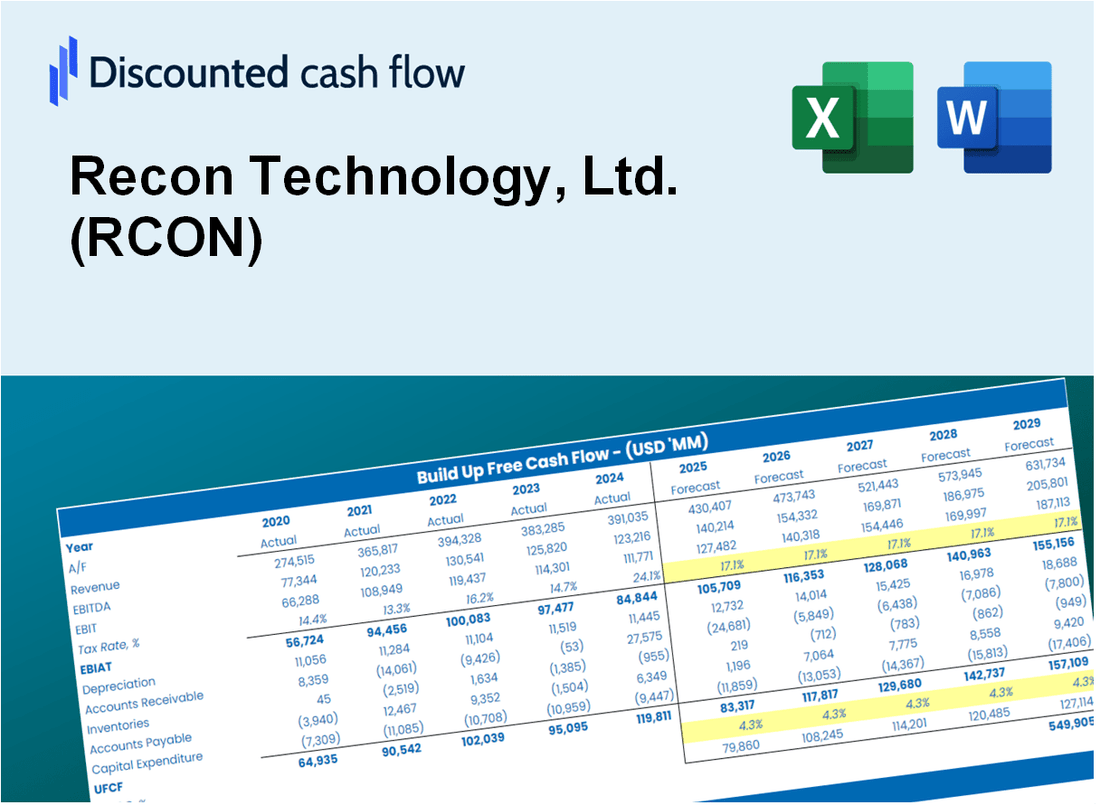
Valoración DCF de Recon Technology, Ltd. (RCON) |
Completamente Editable: Adáptelo A Sus Necesidades En Excel O Sheets
Diseño Profesional: Plantillas Confiables Y Estándares De La Industria
Predeterminadas Para Un Uso Rápido Y Eficiente
Compatible con MAC / PC, completamente desbloqueado
No Se Necesita Experiencia; Fáciles De Seguir
Recon Technology, Ltd. (RCON) Bundle
Ya sea que sea un inversor o analista, esta calculadora DCF (RCON) es su recurso de referencia para una valoración precisa. Precedidos con datos reales de Recon Technology, Ltd., puede ajustar los pronósticos y observar los efectos en tiempo real.
What You Will Get
- Real RCON Financial Data: Pre-filled with Recon Technology’s historical and projected data for precise analysis.
- Fully Editable Template: Modify key inputs like revenue growth, WACC, and EBITDA % with ease.
- Automatic Calculations: See Recon Technology’s intrinsic value update instantly based on your changes.
- Professional Valuation Tool: Designed for investors, analysts, and consultants seeking accurate DCF results.
- User-Friendly Design: Simple structure and clear instructions for all experience levels.
Key Features
- Comprehensive DCF Calculator: Offers detailed unlevered and levered DCF valuation models tailored for Recon Technology, Ltd. (RCON).
- WACC Calculator: Features a pre-built Weighted Average Cost of Capital sheet with adjustable inputs specific to RCON.
- Customizable Forecast Assumptions: Easily modify growth rates, capital expenditures, and discount rates for accurate projections.
- Integrated Financial Ratios: Evaluate profitability, leverage, and efficiency ratios pertinent to Recon Technology, Ltd. (RCON).
- Interactive Dashboard and Charts: Visual representations summarize essential valuation metrics for straightforward analysis.
How It Works
- 1. Download the Template: Obtain and open the Excel file featuring Recon Technology, Ltd. (RCON)'s preloaded data.
- 2. Adjust Key Inputs: Modify essential parameters such as growth rates, WACC, and capital expenditures.
- 3. Instant Results: The DCF model automatically computes intrinsic value and NPV in real-time.
- 4. Explore Different Scenarios: Analyze various forecasts to evaluate different valuation possibilities.
- 5. Present with Assurance: Deliver expert valuation insights to enhance your decision-making process.
Why Choose This Calculator for Recon Technology, Ltd. (RCON)?
- Accuracy: Utilizes real Recon Technology financial data for precise calculations.
- Flexibility: Allows users to easily adjust and test various inputs.
- Time-Saving: Eliminate the need to create a DCF model from the ground up.
- Professional-Grade: Crafted with the expertise and usability expected at the CFO level.
- User-Friendly: Intuitive design makes it accessible for users without extensive financial modeling skills.
Who Should Use This Product?
- Investors: Evaluate Recon Technology’s valuation before making stock transactions.
- CFOs and Financial Analysts: Enhance valuation methodologies and validate forecasts.
- Startup Founders: Understand how established companies like Recon Technology are appraised.
- Consultants: Provide comprehensive valuation reports for client needs.
- Students and Educators: Utilize real-time data to practice and instruct on valuation strategies.
What the Template Contains
- Preloaded RCON Data: Historical and projected financial data, including revenue, EBIT, and capital expenditures.
- DCF and WACC Models: Professional-grade sheets for calculating intrinsic value and Weighted Average Cost of Capital.
- Editable Inputs: Yellow-highlighted cells for adjusting revenue growth, tax rates, and discount rates.
- Financial Statements: Comprehensive annual and quarterly financials for deeper analysis.
- Key Ratios: Profitability, leverage, and efficiency ratios to evaluate performance.
- Dashboard and Charts: Visual summaries of valuation outcomes and assumptions.
Disclaimer
All information, articles, and product details provided on this website are for general informational and educational purposes only. We do not claim any ownership over, nor do we intend to infringe upon, any trademarks, copyrights, logos, brand names, or other intellectual property mentioned or depicted on this site. Such intellectual property remains the property of its respective owners, and any references here are made solely for identification or informational purposes, without implying any affiliation, endorsement, or partnership.
We make no representations or warranties, express or implied, regarding the accuracy, completeness, or suitability of any content or products presented. Nothing on this website should be construed as legal, tax, investment, financial, medical, or other professional advice. In addition, no part of this site—including articles or product references—constitutes a solicitation, recommendation, endorsement, advertisement, or offer to buy or sell any securities, franchises, or other financial instruments, particularly in jurisdictions where such activity would be unlawful.
All content is of a general nature and may not address the specific circumstances of any individual or entity. It is not a substitute for professional advice or services. Any actions you take based on the information provided here are strictly at your own risk. You accept full responsibility for any decisions or outcomes arising from your use of this website and agree to release us from any liability in connection with your use of, or reliance upon, the content or products found herein.