
|
Valoración DCF de Reed's, Inc. (REED) |
Completamente Editable: Adáptelo A Sus Necesidades En Excel O Sheets
Diseño Profesional: Plantillas Confiables Y Estándares De La Industria
Predeterminadas Para Un Uso Rápido Y Eficiente
Compatible con MAC / PC, completamente desbloqueado
No Se Necesita Experiencia; Fáciles De Seguir
Reed's, Inc. (REED) Bundle
¡Mejore sus estrategias de inversión con la calculadora DCF de Reed's, Inc. (Reed)! Utilice datos financieros reales de Reed, ajuste las proyecciones y gastos de crecimiento, y vea instantáneamente cómo estas modificaciones afectan el valor intrínseco de Reed's, Inc. (Reed).
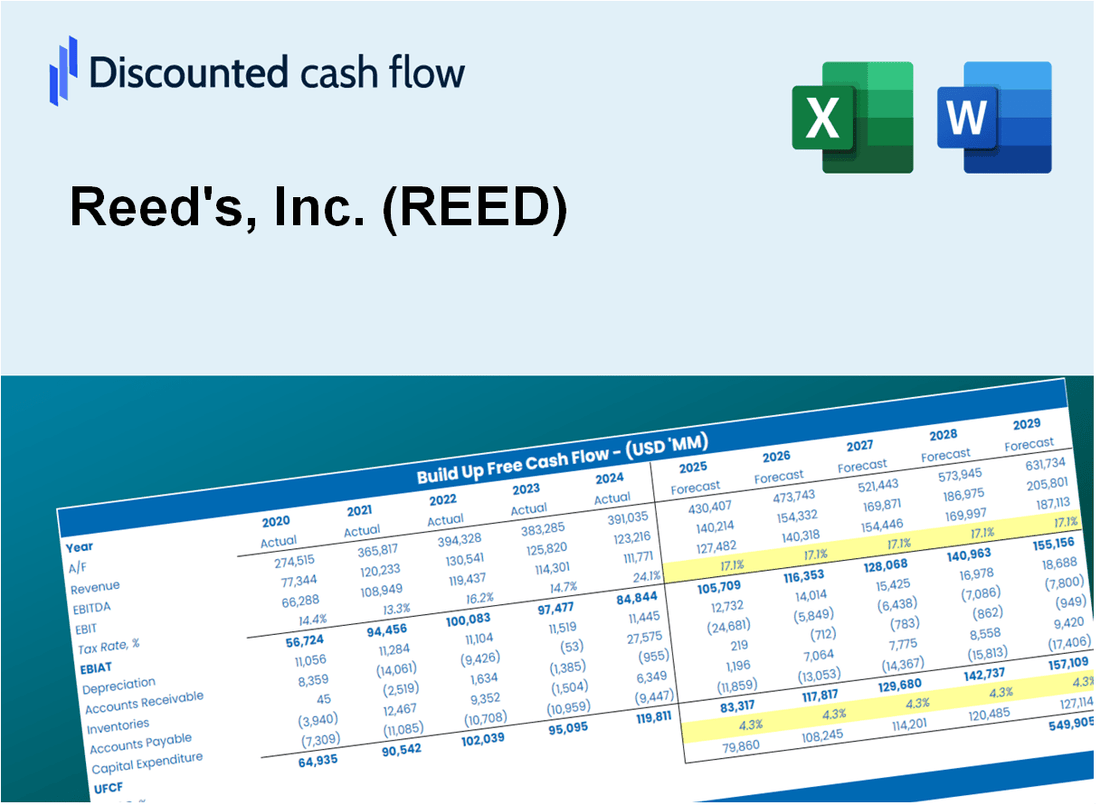
Discounted Cash Flow (DCF) - (USD MM)
| Year | AY1 2020 |
AY2 2021 |
AY3 2022 |
AY4 2023 |
AY5 2024 |
FY1 2025 |
FY2 2026 |
FY3 2027 |
FY4 2028 |
FY5 2029 |
|---|---|---|---|---|---|---|---|---|---|---|
| Revenue | 41.6 | 49.6 | 53.0 | 44.7 | 38.0 | 37.5 | 37.1 | 36.6 | 36.2 | 35.8 |
| Revenue Growth, % | 0 | 19.19 | 6.94 | -15.7 | -15.11 | -1.17 | -1.17 | -1.17 | -1.17 | -1.17 |
| EBITDA | -8.7 | -15.0 | -14.7 | -9.3 | -7.4 | -8.9 | -8.8 | -8.7 | -8.6 | -8.5 |
| EBITDA, % | -20.82 | -30.16 | -27.76 | -20.74 | -19.44 | -23.79 | -23.79 | -23.79 | -23.79 | -23.79 |
| Depreciation | .2 | .2 | .2 | .1 | .3 | .2 | .2 | .2 | .2 | .2 |
| Depreciation, % | 0.49021 | 0.48993 | 0.4242 | 0.3176 | 0.77462 | 0.49931 | 0.49931 | 0.49931 | 0.49931 | 0.49931 |
| EBIT | -8.9 | -15.2 | -15.0 | -9.4 | -7.7 | -9.1 | -9.0 | -8.9 | -8.8 | -8.7 |
| EBIT, % | -21.31 | -30.65 | -28.19 | -21.06 | -20.21 | -24.28 | -24.28 | -24.28 | -24.28 | -24.28 |
| Total Cash | .6 | .0 | .5 | .6 | 10.4 | 2.3 | 2.3 | 2.3 | 2.3 | 2.2 |
| Total Cash, percent | .0 | .0 | .0 | .0 | .0 | .0 | .0 | .0 | .0 | .0 |
| Account Receivables | 5.4 | 6.1 | 6.4 | 5.0 | 4.1 | 4.5 | 4.4 | 4.4 | 4.3 | 4.3 |
| Account Receivables, % | 12.98 | 12.33 | 12.16 | 11.29 | 10.86 | 11.92 | 11.92 | 11.92 | 11.92 | 11.92 |
| Inventories | 11.1 | 17.0 | 16.2 | 11.3 | 8.1 | 10.4 | 10.2 | 10.1 | 10.0 | 9.9 |
| Inventories, % | 26.72 | 34.37 | 30.5 | 25.27 | 21.38 | 27.65 | 27.65 | 27.65 | 27.65 | 27.65 |
| Accounts Payable | 6.7 | 10.4 | 9.8 | 9.1 | 7.0 | 7.1 | 7.0 | 6.9 | 6.8 | 6.8 |
| Accounts Payable, % | 16.21 | 21.04 | 18.49 | 20.43 | 18.33 | 18.9 | 18.9 | 18.9 | 18.9 | 18.9 |
| Capital Expenditure | -.2 | -.3 | .0 | -.1 | -.2 | -.1 | -.1 | -.1 | -.1 | -.1 |
| Capital Expenditure, % | -0.38688 | -0.67542 | -0.00377067 | -0.19682 | -0.40048 | -0.33267 | -0.33267 | -0.33267 | -0.33267 | -0.33267 |
| Tax Rate, % | 0.03800258 | 0.03800258 | 0.03800258 | 0.03800258 | 0.03800258 | 0.03800258 | 0.03800258 | 0.03800258 | 0.03800258 | 0.03800258 |
| EBITAT | -10.0 | -16.3 | -14.9 | -9.4 | -7.7 | -9.1 | -9.0 | -8.9 | -8.8 | -8.7 |
| Depreciation | ||||||||||
| Changes in Account Receivables | ||||||||||
| Changes in Inventories | ||||||||||
| Changes in Accounts Payable | ||||||||||
| Capital Expenditure | ||||||||||
| UFCF | -19.7 | -19.4 | -14.7 | -3.8 | -5.6 | -11.5 | -8.8 | -8.7 | -8.6 | -8.5 |
| WACC, % | 13.21 | 13.21 | 13.17 | 13.21 | 13.21 | 13.2 | 13.2 | 13.2 | 13.2 | 13.2 |
| PV UFCF | ||||||||||
| SUM PV UFCF | -32.9 | |||||||||
| Long Term Growth Rate, % | 2.00 | |||||||||
| Free cash flow (T + 1) | -9 | |||||||||
| Terminal Value | -78 | |||||||||
| Present Terminal Value | -42 | |||||||||
| Enterprise Value | -75 | |||||||||
| Net Debt | 0 | |||||||||
| Equity Value | -75 | |||||||||
| Diluted Shares Outstanding, MM | 8 | |||||||||
| Equity Value Per Share | -9.29 |
What You Will Get
- Editable Forecast Inputs: Effortlessly adjust assumptions (growth %, margins, WACC) to explore various scenarios.
- Real-World Data: Reed's, Inc. (REED) financial data pre-loaded to kickstart your analysis.
- Automatic DCF Outputs: The template computes Net Present Value (NPV) and intrinsic value for you.
- Customizable and Professional: A sleek Excel model that caters to your valuation requirements.
- Built for Analysts and Investors: Perfect for testing projections, validating strategies, and enhancing efficiency.
Key Features
- Real-Life REED Data: Pre-filled with Reed's, Inc.'s historical financials and forward-looking projections.
- Fully Customizable Inputs: Modify revenue growth, profit margins, WACC, tax rates, and capital expenditures.
- Dynamic Valuation Model: Automatic updates to Net Present Value (NPV) and intrinsic value based on your inputs.
- Scenario Testing: Develop multiple forecasting scenarios to evaluate different valuation outcomes.
- User-Friendly Design: Intuitive, organized, and tailored for both professionals and novices.
How It Works
- Download the Template: Gain immediate access to the Excel-based REED DCF Calculator.
- Input Your Assumptions: Modify the yellow-highlighted cells for growth rates, WACC, margins, and additional parameters.
- Instant Calculations: The model will automatically compute Reed's intrinsic value.
- Test Scenarios: Experiment with various assumptions to assess potential valuation shifts.
- Analyze and Decide: Leverage the results to inform your investment or financial analysis.
Why Choose Reed's, Inc. (REED)?
- Time Efficiency: Skip the lengthy research – our insights are readily available.
- Enhanced Precision: Dependable market data and analytics minimize valuation discrepancies.
- Completely Adaptable: Adjust the framework to align with your specific forecasts and assumptions.
- User-Friendly: Intuitive graphs and outputs simplify result interpretation.
- Endorsed by Professionals: Crafted for industry experts who prioritize accuracy and functionality.
Who Should Use This Product?
- Finance Students: Explore financial modeling techniques and apply them to real-world data, particularly for Reed's, Inc. (REED).
- Academics: Integrate advanced valuation models into your research or teaching focused on the beverage industry.
- Investors: Validate your investment strategies and evaluate the performance metrics of Reed's, Inc. (REED).
- Analysts: Enhance your analysis process with a customizable financial model tailored for Reed's, Inc. (REED).
- Small Business Owners: Understand how publicly traded companies like Reed's, Inc. (REED) are assessed and valued in the market.
What the Template Contains
- Pre-Filled Data: Includes Reed's, Inc.'s historical financials and forecasts.
- Discounted Cash Flow Model: Editable DCF valuation model with automatic calculations.
- Weighted Average Cost of Capital (WACC): A dedicated sheet for calculating WACC based on custom inputs.
- Key Financial Ratios: Analyze Reed's, Inc.'s profitability, efficiency, and leverage.
- Customizable Inputs: Edit revenue growth, margins, and tax rates with ease.
- Clear Dashboard: Charts and tables summarizing key valuation results.
Disclaimer
All information, articles, and product details provided on this website are for general informational and educational purposes only. We do not claim any ownership over, nor do we intend to infringe upon, any trademarks, copyrights, logos, brand names, or other intellectual property mentioned or depicted on this site. Such intellectual property remains the property of its respective owners, and any references here are made solely for identification or informational purposes, without implying any affiliation, endorsement, or partnership.
We make no representations or warranties, express or implied, regarding the accuracy, completeness, or suitability of any content or products presented. Nothing on this website should be construed as legal, tax, investment, financial, medical, or other professional advice. In addition, no part of this site—including articles or product references—constitutes a solicitation, recommendation, endorsement, advertisement, or offer to buy or sell any securities, franchises, or other financial instruments, particularly in jurisdictions where such activity would be unlawful.
All content is of a general nature and may not address the specific circumstances of any individual or entity. It is not a substitute for professional advice or services. Any actions you take based on the information provided here are strictly at your own risk. You accept full responsibility for any decisions or outcomes arising from your use of this website and agree to release us from any liability in connection with your use of, or reliance upon, the content or products found herein.